Throughout history, gold has served as the ultimate barometer of global economic and political sentiment. From the Queen of Sheba’s legendary gift to King Solomon to the frantic rush of the Californian gold fields, this precious metal has maintained an eternally impressive grip on the human psyche.
Today, its enduring symbolism of power, wealth, and permanence remains as relevant as ever. Whether driven by central bank buying sprees, rising inflation, or sudden geopolitical shifts, gold consistently proves its worth. In times of market stress, the yellow metal becomes highly attractive—and it is the very volatility of today’s financial markets that keeps online traders constantly scanning for new opportunities [1].
To truly understand where the market is heading, we must first examine the historical gold price and the core drivers behind it. In this guide, we will map out the gold price timeline over the last decade, diving deep into the fundamental shifts and technical indicators that move the market. By exploring the gold price over time —and looking closely at recent price action—you will discover exactly what fuels the enduring momentum of this premier asset class.
Gold as an Asset Class
Gold’s pedigree as a store of value goes back a thousand years. It is perceived as the ultimate object of wealth, and also of monetary accumulation. With this history of utility in currency and as physical jewellery, gold’s status as a favoured safe haven asset and means of diversification endures.
- Safe Haven
Here is the reality for market participants: gold has a unique tendency to retain, and often surge in, value during periods of extreme turbulence and volatility. Because it is widely considered a highly stable asset, the historical gold price has consistently spiked during times of global turmoil.
A prime example? The intense uncertainty of the global pandemic in 2020, when panicked buyers aggressively pushed prices to staggering record highs of $2,075 per ounce [2].
- Inflation hedge
It doesn’t just protect against market panic. Gold is also an incredibly attractive asset during times of broad, general price pressures.
Inflation inherently reduces the buying power of paper currencies, directly affecting how much gold can be bought for a given amount of cash. Looking at a long-term gold price timeline, the metal serves as a proven hedge against inflation, protecting your purchasing power against excessive asset price inflation and long-term currency debasement.
The Flip Side: It is important to acknowledge that during “risk-on” environments—when markets feel safe and economic skies are clear—demand for the precious metal generally falls. There are potentially alternative, albeit risky areas of the market which become more viable.
Gold’s Relationship with the Dollar
One of the most powerful drivers of gold prices is its ongoing relationship with the US dollar.
Because the precious metal is dollar-denominated globally, the greenback serves as its benchmark pricing mechanism. Historically, the two share a strong inverse correlation. When the value of the dollar rises, it puts downward pressure on gold. Why? A stronger dollar makes gold more expensive for buyers using other currencies, causing global physical demand to drop and the price of the metal to fall.
Conversely, a weaker dollar typically pushes the price of gold higher. When the dollar loses strength, foreign investors can purchase more gold for less, driving up demand and spot prices.
Other Factors that will Affect Gold Prices
To make informed, highly profitable decisions before entering the market, you must understand the broader macroeconomic engine that drives the historical gold price. Beyond the dollar, four main pillars dictate market movement:
- Supply and Demand: High demand (from jewellery, tech manufacturing, and ETFs) coupled with limited mining supply will aggressively drive up prices.
- Inflationary Pressures: When inflation runs hot, fiat currencies lose their purchasing power. Gold, however, has maintained its value over centuries. When economic uncertainty and inflation rise, institutional money floods into gold as a protective safe-haven asset.
- Market Sentiment: The collective perception of global stability matters. If geopolitical tensions flare or stock markets face a sudden correction, fear-driven sentiment will instantly trigger algorithmic and retail buying in the gold market.
- Monetary Policy and Interest Rates: This is the heavyweight driver. When central banks (like the US Federal Reserve) raise interest rates, yield-bearing assets like bonds become highly attractive, increasing the “opportunity cost” of holding zero-yield gold, often causing its price to drop. Conversely, when rates are cut, gold becomes highly competitive and often surges.
Understanding these drivers gives you the edge to anticipate market reversals. Whether the dollar is surging or inflation is cooling, trading gold CFDs allows you to go long or short, capitalising on the volatility regardless of market direction.
Price Movement of Gold Over the Last 10 Years and Recent Trends
When you zoom out and analyse the historical gold price, a clear and highly profitable pattern emerges: global crisis consistently breeds trading opportunity.
The Post-Crisis Consolidation (2009–2019)
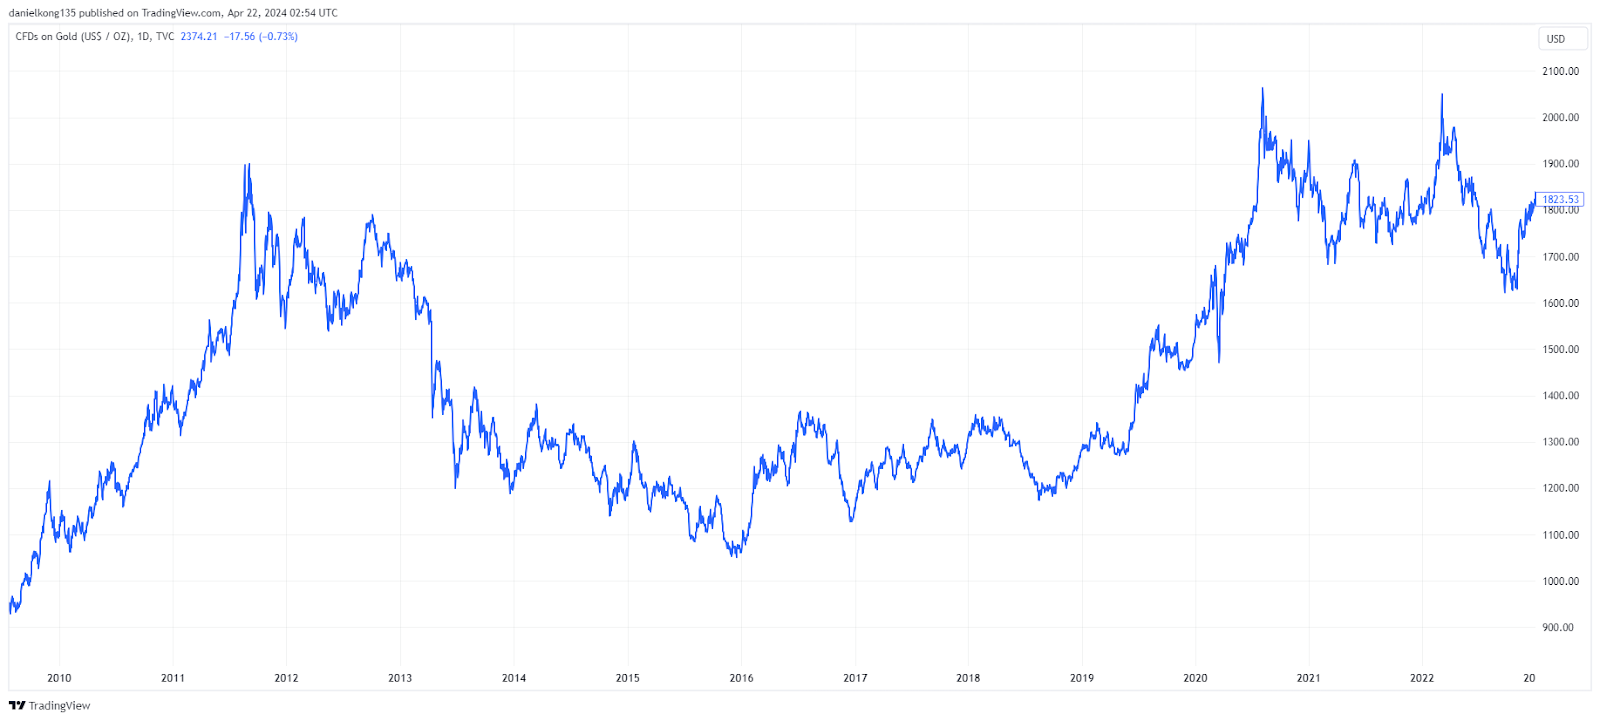
After the Global Financial Crisis (GFC) in 2008 and the subsequent eurozone debt crisis, gold prices remained firmly above $1,000 for over a decade. These historic risk events saw massive investment demand as traders actively sought out reliable hedging tools.
However, looking at the gold prices history chart, you can see the metal faced significant headwinds in 2014. Battered by a rapidly strengthening US dollar and dropping inflation, the shiny metal fell to $1,046 by late December 2015. For the middle part of the decade, the market consolidated between $1,122 and $1,375, quietly building a base for the next macroeconomic catalyst. An upside breakout took place in 2016. The US-China trade war, other geopolitical issues and more central bank demand saw a bullish ascending channel develop.
The Pandemic Peak and Geopolitical Shift (2020–2022)
That catalyst arrived with devastating force in 2020. The extreme uncertainty of the Covid-19 pandemic, coupled with unprecedented global monetary stimulus, drove the market to a then-record high of $2,075.
After consolidating above $1,800 in 2021, the market spiked once again in 2022. The outbreak of the Ukraine conflict and surging global inflation firmly underpinned the market, completely shifting the narrative around the precious metal.
To make the historical gold price timeline easier to digest, here is a clear breakdown of the key technical levels and macroeconomic shifts that defined the post-pandemic market:
- Key Resistance Levels: Following the 2020 highs, the market established significant near-term ceilings. Notably, the price peaked at $1,916 in June 2021 and hit another high of $1,877 in November 2021.
- The Inflation Factor: Elevated inflation dampened “real” interest rates, leaving traders questioning whether central bank market rates would ever truly outpace inflation.
- The 2022 Macro Headwinds: In July 2022, the World Gold Council issued a crucial forecast. They predicted the precious metal would face two significant macroeconomic headwinds which heavily impact short-term market sentiment [3].
- The Late-2022 Reversal: The price dropped into a tight trading range between $1,700 and $1,900. However, by the end of 2022, the market found its footing and began a slow, deliberate uptrend [4].
Gold Price Trend in 2023 and 2024 [5,6,7]
When analysing the historical gold price during 2023 and 2024, active traders are presented with a textbook example of how macroeconomic shifts and geopolitical crises drive massive market volatility.
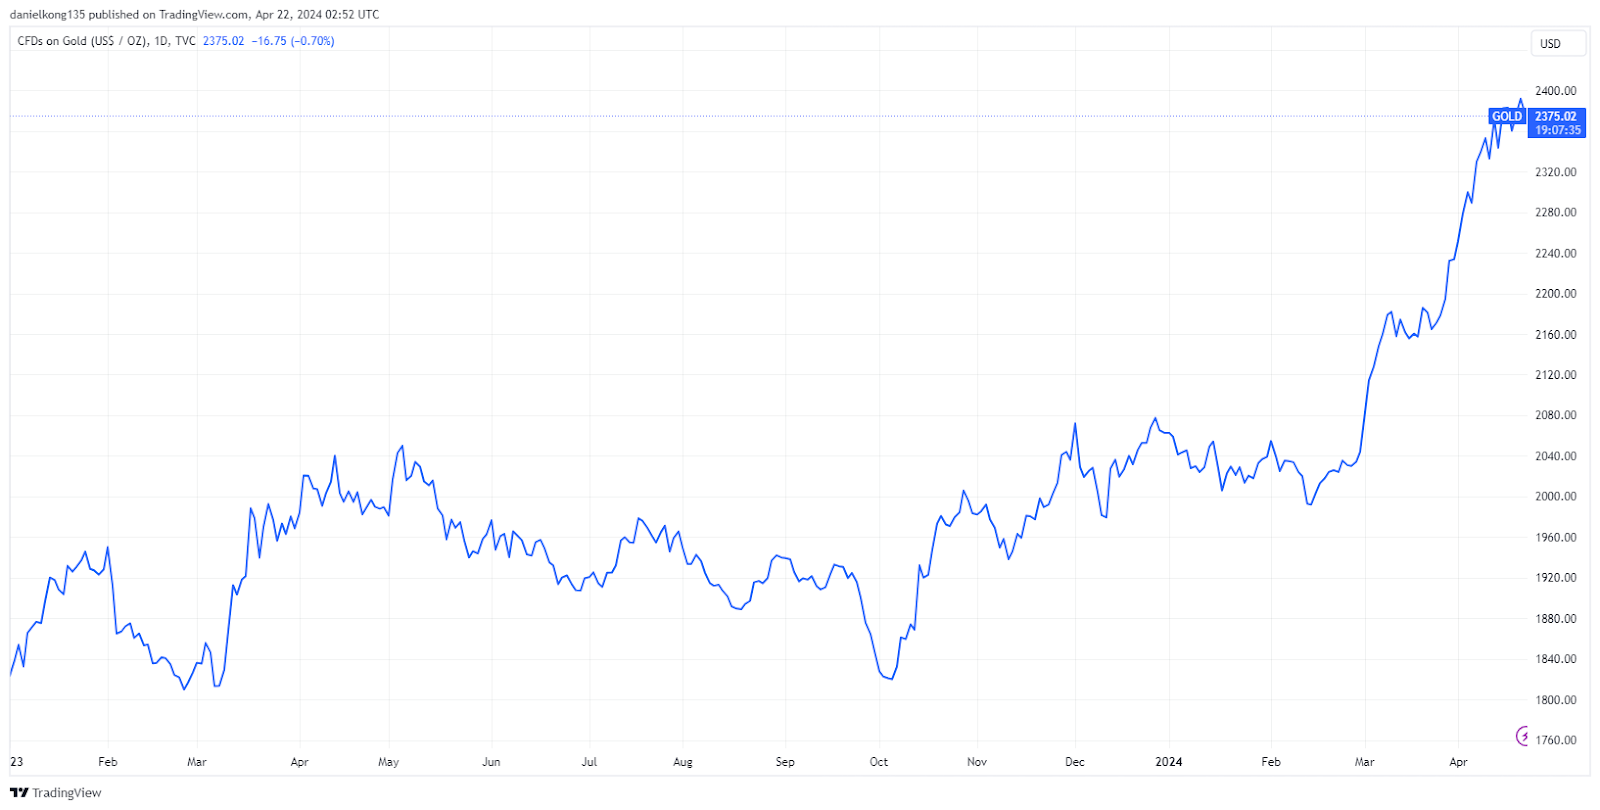
2023: A Year of Extreme Fluctuations
Looking at the gold price timeline, 2023 was defined by varied global demand and significant price swings. While central banks and Chinese consumers aggressively increased their purchases, this was temporarily counterbalanced by reduced interest in ETFs and a dip in the Indian market.
- The Early Rally (January): Starting the year at $1,839 per ounce, a weaker US dollar and lower US Treasury yields propelled the market to a January peak of $1,950.17.
- The Fed Pullback (February): The momentum shifted quickly. After a US Federal Reserve rate hike, a strengthening dollar, and rising yields drove the price back down to $1,809.87.
- The Banking Crisis Pivot (March–April): The sudden collapse of Silicon Valley Bank (SVB) triggered widespread financial panic, instantly reviving gold’s status as a secure investment. Driven by this banking crisis and broader trade disputes, the market rallied to break the $2,000 mark by the first week of April.
- Late-Year Consolidation & Conflict (Q3–Q4): After a Q3 decline caused by the Fed’s decision to hold interest rates steady, the gold price over time began to surge again in the fourth quarter. The outbreak of the Israel-Hamas conflict fueled immense geopolitical uncertainty, sending safe-haven buyers rushing back into the market.
2024: Smashing All-Time Highs
The bullish momentum from late 2023 carried directly into the new year, with the prices climbing over 17% from the start of the year through April.
On 12 April 2024, gold reached a new all-time high of $2,431.29 as geopolitical tensions worsened with the escalating conflict between Israel and Iran.
The Takeaway: These rapid price swings highlight exactly why active traders thrive in this market. Whether prices are dipping on Fed rate hikes or surging on global conflict, trading CFDs allows you to capitalise on every major directional move.
Stop Watching, Start Trading: Capitalise on Gold Market Volatility
Gold continues to be an essential asset class and a premier safe-haven investment, offering an unmatched store of value, powerful diversification, and proven inflation-hedging properties. When you study a historical gold price chart, the reality becomes clear: the history of the price of gold is defined by periods of extreme volatility driven by global risk events and economic uncertainty.
However, just looking at the gold price over time is not enough. Passive investors simply watch the gold price timeline unfold, but active traders capitalise on it.
Are you ready to apply your favourite technical analysis indicators to real-world gold trading strategies?
Take control of your portfolio today. Get started with Vantage to trade gold CFDs (XAU/USD) and gain immediate access to live market data, expert insights, and institutional-grade trading tools designed to help you conquer the volatile gold market. Open a live account today!
Reference
- “Commodities: The Portfolio Hedge – Investopedia”. https://www.investopedia.com/articles/trading/05/021605.asp . Accessed 1 May 2022.
- “Has Gold Been a Good Investment Over the Long Term – Investopedia”. https://www.investopedia.com/ask/answers/020915/has-gold-been-good-investment-over-long-term.asp#toc-gold-vs-stocks-and-bonds . Accessed 1 May 2022.
- “Gold Demand Trends Full Year 2022 – World Gold Council”. https://www.gold.org/goldhub/research/gold-demand-trends/gold-demand-trends-full-year-2022/outlook . Accessed 9 Mar 2023.
- “Gold Price History: Highs and Lows – Investopedia”. https://www.investopedia.com/gold-price-history-highs-and-lows-7375273#toc-a-brief-history-of-gold . Accessed 19 April 2024.
- “Gold Price 2023 Year-End Review – LinkedIn”. https://www.linkedin.com/pulse/gold-price-2023-year-end-review-xuan-ce-wang-hpnic . Accessed 19 April 2024.
- “Gold Prices Are Nearing An All-Time High. Could They Push Even Higher? – Forbes”. https://www.forbes.com/sites/qai/2023/04/06/gold-prices-are-nearing-an-all-time-high-could-they-push-even-higher/?sh=6cd7f1da19d6 . Accessed 19 April 2024.
- Gold on track for weekly rise as Middle East risks loom – Reuters”. https://www.reuters.com/markets/commodities/safe-haven-gold-rises-israeli-attack-iran-raises-concerns-wider-conflict-2024-04-19/ . Accessed 19 April 2024.