[DAILY TRADING] XAUUSD, 24 June 2026 – Gold Price Drops to $4,095 as Hawkish Fed Lifts Dollar
Vantage Editorial Team >
Vantage Editorial Team >
Vantage is a global, multi-asset broker with a team of in-house writers and market analysts who produce educational and insightful trading content for traders of all levels.
![[DAILY TRADING] XAUUSD, 24 June 2026 – Gold Price Drops to $4,095 as Hawkish Fed Lifts Dollar](https://www.vantagemarkets.co/wp-content/uploads/2026/06/XAUUSD_banner_900x430_optimized-3.webp)
Gold (XAUUSD) is trading near $4,095.48 on the Vantage XAUUSD CFD as of 01:26 UTC on 24 June 2026, sitting below both the 15-min 50-period MA (4,157) and 200-period MA (4,117). The gold price today is down sharply from the $4,220 session high seen on 22 June 2026, after a broad selloff through 23 June 2026 coincided with the US dollar breaking above the 100 level on the DXY index. This is not financial advice.
Two forces are in play. The Federal Reserve‘s hawkish shift under Chair Kevin Warsh is driving the dollar higher and applying pressure to non-yielding gold. At the same time, a US-Iran 60-day peace roadmap has reduced the energy-driven inflation premium that had kept rate expectations elevated all year. Tomorrow’s US PCE Price Index release (25 June 2026) is the single data event most likely to move gold prices this week.
Key points
- XAUUSD gold price trades near $4,095 on the Vantage CFD as of 01:26 UTC on 24 June 2026, with both the 15-min 50-period MA (4,157) and 200-period MA (4,117) declining above price.
- The Fed held rates at 3.50%-3.75% on 18 June 2026 but nine of 18 officials now project at least one rate hike in 2026, lifting the dollar and increasing the opportunity cost of holding gold.[1]
- Tomorrow’s Core PCE Price Index (25 June 2026, 08:30 EDT per BEA) is the key data release: a hotter reading could extend gold’s slide, while a softer print may reduce rate-hike expectations and support gold prices.
XAUUSD chart analysis: what the 15-min setup shows
The XAUUSD chart covers 21-24 June 2026. Price peaked around $4,220-4,230 in the early hours of 22 June, with the 15-min 50-period and 200-period MAs tracking higher in line with price. The picture reversed sharply during 23 June’s US session: a sustained selloff drove gold through both moving averages, pressing to a session low near $4,060-4,065. Price has partially recovered to the $4,095 area but remains well below both MAs, which are now declining – a bearish short-term structure on this XAUUSD technical analysis view.
The RSI (14) on the TradingView setup used for this analysis reads 41.40 (fast line) and 36.76 (signal line) – both below the 50 midline but not yet at oversold levels. Volume from the Vantage CFD feed was elevated through the 23 June 2026 decline and has ticked higher again in the most recent 24 June candles near $4,095. Discover how you can trade Gold at Vantage Markets here.
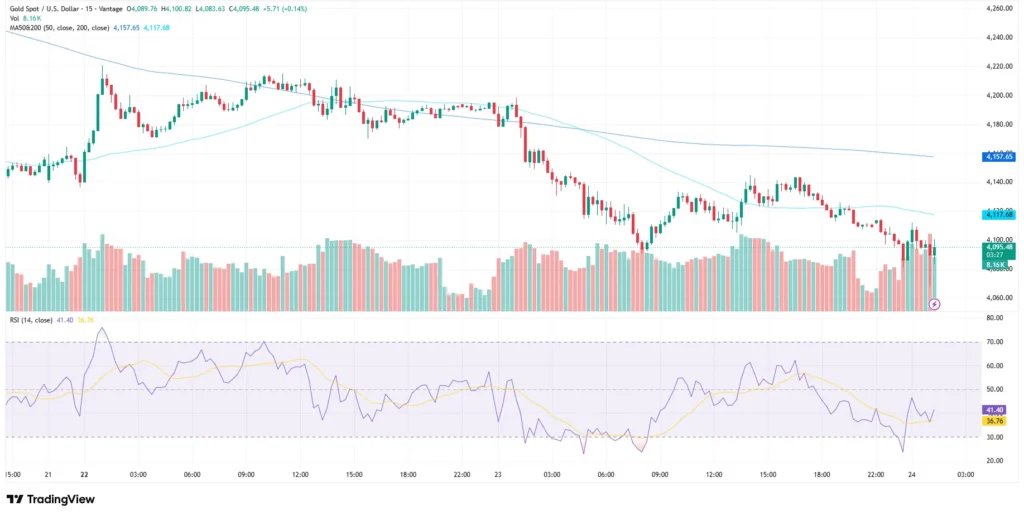
Key chart levels traders are monitoring. These are reference levels, not trade signals:
| Level | Price (USD) | Zone | Context |
| Resistance | 4,117 | 15-min 200-period MA | Nearer-term cap to watch |
| Resistance | 4,157 | 15-min 50-period MA | Declining; well above price |
| Support | 4,060 – 4,065 | 23 Jun session low | Recent demand area |
| Support | 4,023 | June 2026 swing low | Noted by FXStreet |
Table 1: XAUUSD key levels as of 01:26 UTC, 24 June 2026. Sources: TradingView, Vantage XAUUSD CFD, FXStreet. Indicative only.
What is driving gold prices today
Hawkish Fed keeps dollar elevated
At its 17 June 2026’s meeting, the FOMC held rates at 3.50%-3.75% in its first decision under Chair Kevin Warsh. The dot plot showed nine of 18 officials projecting at least one rate hike in 2026, and the committee removed language indicating a bias toward cutting.[1] Gold, a non-yielding asset, faces a rising opportunity cost when Treasury yields climb. Morgan Stanley research notes the 10-year real yield is near 2.2%, while Goldman Sachs revised its year-end gold forecast down to $4,900 from $5,400, citing reduced rate-sensitive ETF demand.[2,3]
Middle East peace deal and Strait of Hormuz shipping
Earlier in June, the US and Iran signed a memorandum of understanding for a 60-day negotiation window, with Iran agreeing to allow toll-free passage through the Strait of Hormuz. Shipping activity through the waterway has increased, with Kuwait, the UAE, and Iran itself ramping exports.[4,5] Lower oil prices reduce energy-driven inflation pressure on the Fed, which in theory supports gold. However, gold news on 23 June showed the market remained focused on the Fed rather than peace deal progress, selling the metal even as the framework held intact.
What to watch: key events for gold prices this week
- Core PCE Price Index, 25 June 2026: The Fed’s preferred inflation gauge. A hotter-than-expected reading reinforces the case for a September or December rate hike, which could strengthen the dollar and extend pressure on XAUUSD. A softer reading may reduce rate-hike pricing.
- Revised Q1 GDP, 26 June 2026: A weak growth reading alongside sticky inflation would create a stagflationary backdrop – historically a complex environment for gold given competing rate and demand forces.
- US-Iran peace talks, Ongoing: Any deterioration in the 60-day roadmap or renewed disruption to Strait of Hormuz shipping would reignite energy-driven inflation concerns and reshape the rate outlook.
Risk considerations for XAUUSD traders
Gold shed around $66 on 23 June 2026 in a single session – intraday range assumptions break down fast around major data releases. The short-term XAUUSD chart has both MAs declining above price and RSI below 50. A recovery through the 15-min 200-period MA (4,117) would be the first step to changing that picture.
To the downside, the 23 June session low near $4,060-4,065 and the June swing low around $4,023 (as noted by FXStreet[6]) are the areas traders are monitoring. The 4,060-4,065 area and the June swing low near 4,023 remain important technical reference levels ahead of the PCE release.
Leverage amplifies both the potential advantages and the downside on CFD positions. In a data-heavy session where gold, the US dollar index, and correlated instruments may all experience significantly larger-than-normal price swings around major macroeconomic releases.

RISK WARNING: CFDs are complex financial instruments and carry a high risk of losing money rapidly due to leverage. You should ensure you fully understand the risks involved and carefully consider whether you can afford to take the high risk of losing your money before trading.
Disclaimer: The information is provided for educational purposes only and doesn’t take into account your personal objectives, financial circumstances, or needs. It does not constitute investment advice. We encourage you to seek independent advice if necessary. The information has not been prepared in accordance with legal requirements designed to promote the independence of investment research. No representation or warranty is given as to the accuracy or completeness of any information contained within. This material may contain historical or past performance figures and should not be relied on. Furthermore estimates, forward-looking statements, and forecasts cannot be guaranteed. The information on this site and the products and services offered are not intended for distribution to any person in any country or jurisdiction where such distribution or use would be contrary to local law or regulation.
References
[1] “Gold: Fed’s Hawkish Shift Meets Iran Peace Deal Optimism – Investing.com” https://www.investing.com/analysis/gold-feds-hawkish-shift-meets-iran-peace-deal-optimism-200682381 Accessed on 24 June 2026.
[2] “Gold Is Down 25%. Morgan Stanley Says One Number Unlocks $5,200 – GoldSilver.com” https://goldsilver.com/industry-news/article/gold-price-outlook-2026-morgan-stanley/ Accessed on 24 June 2026.
[3] “Gold edges lower to near $4,150 on US-Iran peace uncertainty, hawkish Fed signals – FXStreet” https://www.fxstreet.com/news/gold-edges-lower-to-near-4-150-on-us-iran-peace-uncertainty-hawkish-fed-signals-202606212334 Accessed on 24 June 2026.
[4] “$4,300 Reclaimed: Gold Bounces as US-Iran Peace Deal Signing Offsets Fed’s Hawkish Hold – FXStreet” https://www.fxstreet.com/analysis/4-300-reclaimed-gold-bounces-as-us-iran-peace-deal-signing-offsets-feds-hawkish-hold-202606180319 Accessed on 24 June 2026.
[5] “Gold Price – Historical Data and News – Trading Economics” https://tradingeconomics.com/commodity/gold Accessed on 24 June 2026.
[6] “Gold price slides as AI rout fuels US Dollar flight – FXStreet” https://www.fxstreet.com/news/gold-price-slides-as-ai-rout-fuels-us-dollar-flight-202606231803 Accessed on 24 June 2026.
[7] “Gold Declines as Hawkish Fed Outweighs Relief from US-Iran Deal – Bloomberg via Yahoo Finance” https://finance.yahoo.com/markets/commodities/articles/gold-jumps-peace-deal-optimism-012451156.html Accessed on 24 June 2026.
[8] “Gold Price Predictions for 2026 and 2027 – J.P. Morgan Global Research” https://www.jpmorgan.com/insights/global-research/commodities/gold-prices Accessed on 24 June 2026.
