Gold Price Today – XAUUSD Near $4,017 as Hawkish Fed Dominates
Vantage Editorial Team >
Vantage Editorial Team >
Vantage is a global, multi-asset broker with a team of in-house writers and market analysts who produce educational and insightful trading content for traders of all levels.
The Vantage XAUUSD CFD last traded near $4,017.35 as of 09:47 UTC on 26 June 2026 (17:47 GMT+8), extending a multi-week decline that has taken gold roughly 28% below its January all-time high of $5,595.46.
Two forces have converged on the gold price today. The Federal Reserve’s hawkish June policy shift under Chair Kevin Warsh has effectively removed expectations for 2026 rate cuts, with markets increasingly pricing the possibility of rate hikes. At the same time, the Middle East conflict risk premium has unwound as US-Iran peace talks in Switzerland produced a 60-day roadmap.
Gold now sits between a stronger dollar, rising real Treasury yields, and structural central bank demand that continues to provide an important source of structural support. All prices are from the Vantage XAUUSD CFD as of 09:47 UTC, 26 June 2026 (17:47 GMT+8). Charts are from TradingView. This is not financial advice.
Key Points
- Gold price today near $4,017 on the Vantage XAUUSD CFD, down roughly 28% from the January record of $5,595.46, as a stronger dollar and rising rate-hike bets weigh on the non-yielding metal.
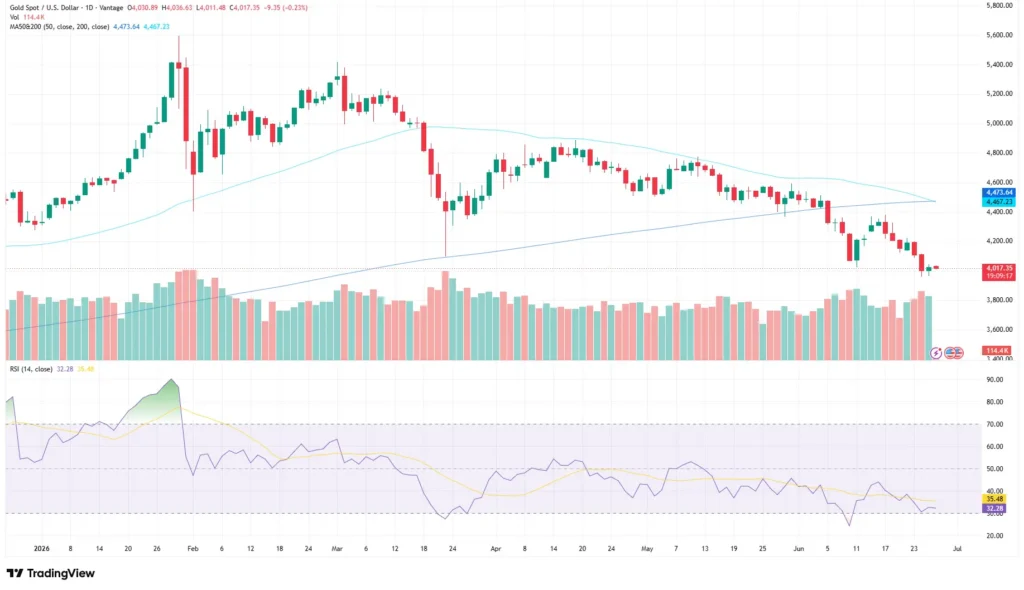
- On the daily XAUUSD chart, both the 50-period MA (4,473.64) and the 200-period MA (4,467.23) sit above price and are converging, while the RSI (14, close) reads 32.28, near oversold levels, per the TradingView setup used for this analysis.
- The US PCE Price Index and revised Q1 GDP, both due 26 June 2026, are the near-term data events most likely to move the XAUUSD gold price this week.
XAUUSD chart: what the daily setup shows
The daily XAUUSD chart shows a sharp rally into January followed by a sustained bearish reversal. Gold opened 2026 near $3,900, surged to $5,595.46 on 29 January on safe-haven demand tied to the Middle East conflict, and has since given back most of those gains.
The 50-period MA sits at 4,473.64 and the 200-period MA at 4,467.23, per the TradingView setup used for this analysis. Both remain above price, while the 50-period MA continues to decline toward the relatively flatter 200-period MA. Repeated rally attempts during May and June failed beneath the converging moving-average zone.
The RSI (14, close) reads 32.28, with the RSI moving-average overlay at 35.48, per the TradingView setup used for this analysis. Both are approaching oversold territory. The fast line dipped near 20 during the steepest part of the 24 June selloff before partially recovering. Volume from the Vantage CFD feed remained elevated through the decline.
Three forces driving the XAUUSD gold price
The Fed’s hawkish hold: the dominant driver
At the 17 June 2026 FOMC meeting, the Fed held rates at 3.50% to 3.75% but stripped all forward guidance on cuts from the policy statement. The Summary of Economic Projections showed nine of the 18 policymakers who submitted projections now expect at least one rate hike in 2026, with the median Fed Funds Rate at 3.80% by year-end.[1]
Markets increasingly priced the possibility of a year-end rate hike. The 10-year US Treasury yield briefly rose above 4.5%, and the US Dollar Index climbed to a 13-month high.[2] For gold, which yields nothing, this is the core headwind. Rising real yields reduce the relative appeal of a non-yielding asset, and a stronger dollar makes gold more expensive in other currencies.
Goldman Sachs cut its year-end gold target from $5,400 to $4,900 on 19 June, noting that with all 2026 rate cuts removed from its forecast and easing delayed to June 2027, ETF demand assumptions had to be reduced accordingly.[3] ING also revised lower, now expecting gold to average $4,300 per ounce in Q3 2026 and $4,600 in Q4, down from prior estimates of $4,850 and $5,000.[4]
The Middle East risk premium unwind
US-Iran peace talks in Switzerland resulted in a 60-day peace roadmap, with the US temporarily lifting oil sanctions on Iran.[5] Brent crude fell sharply as a result, reducing the energy-driven inflation premium that had been one of gold’s structural supports for much of 2026.
This makes the current setup more complex. Easing oil pressure reduces stagflation concerns, but the Fed that was reluctant to cut when inflation was energy-driven is now openly discussing a hike. The geopolitical support for gold has weakened, while the Fed’s restrictive stance has remained intact.
Central bank demand: still the structural floor
Not all of the picture is bearish. According to the World Gold Council’s Q1 2026 Gold Demand Trends report, global gold demand reached 1,231 tonnes in Q1, with central banks adding a net 244 tonnes, the highest January-to-March pace on a five-year average basis.[6]
The People’s Bank of China extended its buying streak to 19 consecutive months as of the latest reported data, per the World Gold Council. As ING Commodities Strategist Ewa Manthey noted in the bank’s revised forecast, central bank demand is structural and does not respond to Fed meeting outcomes the way ETF demand does.[4]
XAUUSD levels to watch
The table below covers the zones most relevant to the XAUUSD gold price and its macro context. These are reference levels, not trade signals.
| Instrument | Support | Resistance | What traders are watching |
| XAUUSD | $3,900 / $4,000 | $4,300 / $4,473 | Below both MAs; RSI in oversold territory |
| DXY | 100.00 | 102.00 / 103.00 | 13-month high; dollar strength weighing on gold |
| 10-yr US Treasury Yield | 4.35% | 4.55% / 4.70% | Yield above 4.5% is the core headwind for non-yielding gold |
Table 1: Key levels as of 09:47 UTC, 26 June 2026. Sources: TradingView (Vantage XAUUSD CFD setup), Reuters, CNBC. Indicative only.
The $4,000 level is the zone most referenced by current gold price news. Gold crossed briefly below it on 24 June before recovering, and the area coincides with the March 2026 lows. A sustained daily close below $4,000 removes the last widely-cited reference before a deeper retracement. Above, the $4,300 to $4,473 zone represents the converging MA cluster. Repeated rallies in June have stalled in that region, and the level has acted as resistance on every test since late May.
On the dollar side, the DXY at 13-month highs above 101 is a companion indicator. XAUUSD and the DXY have traded in inverse correlation for most of 2026, and any softening in the dollar would likely provide relief for the gold price today.
What to watch: key events for XAUUSD this week
- PCE Price Index, 26 June 2026: The Fed’s preferred inflation gauge. ING’s revised forecast already incorporates core PCE at 3.3% year-on-year. A hotter reading reinforces the case for a September rate hike and extends pressure on the gold price today. A softer print reduces that probability.
- Revised Q1 GDP, 26 June 2026: Weak growth alongside sticky inflation creates a stagflationary read, historically a complex backdrop for gold.
- University of Michigan inflation expectations, June (Final): Elevated consumer inflation expectations strengthen the committee’s case for action and reinforce the stronger-dollar, higher-yield environment pressuring gold news this week.
- US-Iran peace talks, ongoing: Any deterioration in the 60-day roadmap or fresh disruption to Middle East shipping lanes would reignite energy-inflation concerns and reshape the rate outlook for XAUUSD.
Gold shed more than $100 in a single session on 24 June 2026. Intraday range assumptions break down fast around data releases of this magnitude. Traders watching XAUUSD gold price news today via the Vantage CFD should review Stop Loss placement with the $4,000 support and the converging MA cluster near $4,467 to $4,473 as the first reference zones for exposure management. Correlated positions across gold, yen, and short-dollar pairs can all move in the same direction on a risk-off headline, so combined exposure is worth reviewing ahead of the PCE release.
Leverage amplifies both gains and losses in proportion to the position size held, and it works in both directions. With PCE and revised GDP due on 26 June 2026, and ongoing geopolitical variables capable of moving XAUUSD gold prices within minutes, reviewing position sizing relative to account equity is a practical step before data lands.

RISK WARNING: CFDs are complex financial instruments and carry a high risk of losing money rapidly due to leverage. You should ensure you fully understand the risks involved and carefully consider whether you can afford to take the high risk of losing your money before trading.
Disclaimer: The information is provided for educational purposes only and doesn’t take into account your personal objectives, financial circumstances, or needs. It does not constitute investment advice. We encourage you to seek independent advice if necessary. The information has not been prepared in accordance with legal requirements designed to promote the independence of investment research. No representation or warranty is given as to the accuracy or completeness of any information contained within. This material may contain historical or past performance figures and should not be relied on. Furthermore estimates, forward-looking statements, and forecasts cannot be guaranteed. The information on this site and the products and services offered are not intended for distribution to any person in any country or jurisdiction where such distribution or use would be contrary to local law or regulation.
References
[1] “Fed holds rates steady but dot plot signals hawkish split, June 2026 — FXStreet” https://www.fxstreet.com/news/gold-price-whipsaws-as-warsh-fed-holds-hawkish-dots-bite-202606171815 Accessed on 26 June 2026.
[2] “Gold hits over seven-month low as dollar firms, rate hike bets rise — CNBC” https://www.cnbc.com/2026/06/24/gold-slips-to-two-week-low-as-fed-rate-hike-bets-buoy-dollar.html Accessed on 26 June 2026.
[3] “Goldman Sachs cuts gold price forecast to $4,900 — Mining.com” https://www.mining.com/goldman-cuts-gold-price-forecast-down-to-4900/ Accessed on 26 June 2026.
[4] “Gold’s correction prompts a forecast reset — ING Think” https://think.ing.com/articles/golds-correction-prompts-a-forecast-reset/ Accessed on 26 June 2026.
[5] “Gold price drops to $4,095 as hawkish Fed lifts dollar — Vantage Markets” https://www.vantagemarkets.co/market-analysis/xauusd-gold-price-analysis-june-24-2026/ Accessed on 26 June 2026.
[6] “Gold Demand Trends Q1 2026 — World Gold Council” https://www.gold.org/goldhub/research/gold-demand-trends/gold-demand-trends-q1-2026 Accessed on 26 June 2026.
