[DAILY TRADING] XAUUSD 11 June 2026 — Gold Falls to Multi-Month Low at $4,027 as US CPI Hits 4.2%
Vantage Editorial Team >
Vantage Editorial Team >
Vantage is a global, multi-asset broker with a team of in-house writers and market analysts who produce educational and insightful trading content for traders of all levels.
![[DAILY TRADING] XAUUSD 11 June 2026 — Gold Falls to Multi-Month Low at $4,027 as US CPI Hits 4.2%](https://www.vantagemarkets.co/wp-content/uploads/2026/06/XAUUSD_banner_900x430_optimized-2.webp)
The Vantage XAUUSD CFD is at 4,087.18 as of 08:54 UTC on 11 June 2026. Gold price now sits near a multi-month low after touching 4,027 late on 10 June.[1] The move followed the US May Consumer Price Index (CPI) print of 4.2% year-on-year, the highest reading since April 2023, which reinforced market expectations for a prolonged Federal Reserve (Fed) tightening stance.[2]
All prices are as of 08:54 UTC on 11 June 2026. Chart sourced from TradingView via Vantage and is indicative. This is not financial advice.
Key Points
- Gold price touched 4,027 on 10 June before recovering to 4,087 as of 08:54 UTC on 11 June. Price remains below the MA50 (4,190.99) but is sitting just above the MA200 (4,078.75) on the 15-minute chart.[1]
- US May CPI climbed 4.2% year-on-year, the hottest reading in over three years. According to the Bureau of Labor Statistics (BLS), the energy index accounted for over 60% of the monthly all items increase.[3] Core CPI came in at 0.2% month-on-month, below the 0.4% April reading.[4]
- The Fed meeting on 16–17 June is the next key event. Markets price a hold as near certain according to CME FedWatch data.[5] The focus is on new Fed Chair Kevin Warsh’s dot plot and whether the median projection shifts toward a year-end hike.
XAUUSD Chart: From 4,350 to 4,027 in 46 Hours
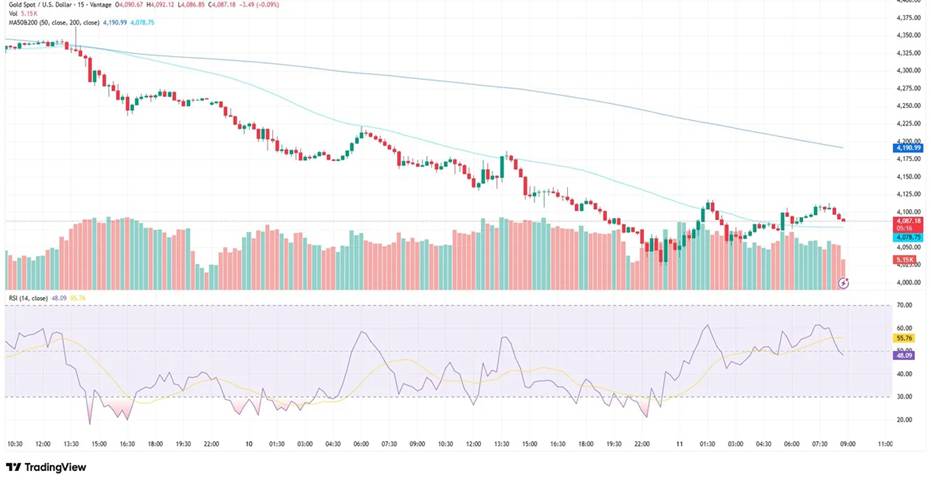
Figure 1: XAUUSD 15M, Vantage (TradingView, https://www.tradingview.com/symbols/XAUUSD/) Accessed on 11 June 2026, 08:54 UTC. Indicative only.
The 15M chart spans 9–11 June. Price traded near 4,350 at the 9 June open before a sustained decline into the CPI release on 10 June at 12:30 UTC. Volume on the Vantage feed spiked through the move from the 4,200 area to the 4,027-session low. The partial recovery to 4,087 places prices just above the MA200 (4,078.75), while the MA50 (4,190.99) remains considerably higher. RSI (14) sits at 48.09 — neutral, not oversold.
XAUUSD News Today: What Is Driving Gold Price
May CPI at 4.2% — Energy the Catalyst, Core More Contained
The BLS confirmed on 10 June that headline CPI rose 4.2% year-on-year in May 2026, the highest reading since April 2023.[2] The BLS noted that the energy index accounted for over 60% of the monthly all items increase, with energy prices rising 3.9% in May and gasoline up 40.5% year-on-year.[3] Core CPI rose 0.2% month-on-month, below both the April reading of 0.4% and some market forecasts.[4]
Gold, as a non-yielding asset, faces headwinds when rate expectations rise. Chris Gaffney, President of Global Markets at EverBank, noted the 10 June decline was primarily driven by the rate implications of the CPI data.[7]
US-Iran Conflict: The Hormuz Factor
US forces conducted fresh strikes on Iranian targets following an incident involving a US Apache helicopter near the Strait of Hormuz. Iran reportedly responded by targeting US vessels.[8] The Strait carries roughly 20% of global oil and liquefied natural gas (LNG) supplies.[9] Gold would typically attract safe-haven flows from this kind of geopolitical stress.
However, the same conflict that pushes oil higher also raises inflation expectations, reinforcing tighter monetary policy and reducing the appeal of non-yielding bullion. J.P. Morgan’s head of Base and Precious Metals, Greg Shearer, noted gold remains capped as investors weigh whether the Fed may need to respond to energy-driven inflation with rate hikes.[10]
XAUUSD Technical Analysis: Key Levels as of 08:54 UTC
Reference levels on the Vantage XAUUSD CFD feed. These are not trade signals.
| Pair | Support | Resistance | What is happening |
| XAUUSD | 4,027 / 3,990 | 4,100 / 4,191 | At 4,087 as of 08:54 UTC; holding just above MA200 (4,078.75) after recent multi-month session low |
| DXY | 103.50 | 104.80 / 105.20 | Firm on 4.2% CPI; elevated rate hike bets supporting dollar |
| US 10Y Yield | 4.40% | 4.70% / 4.80% | Elevated, raising opportunity cost for non-yielding gold |
Table 1: Vantage XAUUSD CFD levels as of 08:54 UTC, 11 June 2026. Sources: TradingView, Investing.com. Indicative only.
Gold Price Forecast: What to Watch Today
- Fed meeting 16–17 June (dot plot): A hold is near-certain.[5] The new dot plot under Fed Chair Kevin Warsh is the variable — any shift in the median year-end rate projection will be closely monitored for implications on gold CFD pricing.[10]
- University of Michigan June inflation expectations (13 June): An early read on whether energy costs are feeding into longer-term consumer price expectations — a factor that may shape the tone of Warsh’s press conference.
- US-Iran negotiations: A credible Hormuz reopening would shift the oil and inflation picture materially, altering the rate hike calculus for gold.[9]
- 52-week range context: The Vantage XAUUSD CFD 52-week range is 3,247.86–5,595.46.[1] At 4,087, gold sits in the lower third of that band, reflecting the scale of the correction from January highs.
Market participants continue monitoring XAUUSD alongside oil and USD-correlated instruments ahead of the FOMC meeting. The 4,027-session low and the MA200 at 4,078.75 are the two nearest reference levels on the current chart.
Leverage in CFD trading cuts both ways. Volatility remains elevated ahead of the 16–17 June Fed decision, with ongoing Middle East developments and key macro data continuing to drive intraday moves in gold.
RISK WARNING: CFDs are complex financial instruments and carry a high risk of losing money rapidly due to leverage. You should ensure you fully understand the risks involved and carefully consider whether you can afford to take the high risk of losing your money before trading.
Disclaimer: The information is provided for educational purposes only and doesn’t take into account your personal objectives, financial circumstances, or needs. It does not constitute investment advice. We encourage you to seek independent advice if necessary. The information has not been prepared in accordance with legal requirements designed to promote the independence of investment research. No representation or warranty is given as to the accuracy or completeness of any information contained within. This material may contain historical or past performance figures and should not be relied on. Furthermore estimates, forward-looking statements, and forecasts cannot be guaranteed. The information on this site and the products and services offered are not intended for distribution to any person in any country or jurisdiction where such distribution or use would be contrary to local law or regulation.
References
[1] “XAU/USD Gold Spot US Dollar Price — Investing.com” https://www.investing.com/currencies/xau-usd Accessed on 11 June 2026.
[2] “Consumer Price Index Summary May 2026 — US Bureau of Labor Statistics” https://www.bls.gov/news.release/cpi.nr0.htm Accessed on 11 June 2026.
[3] “Consumer Price Index Summary May 2026 — US Bureau of Labor Statistics” https://www.bls.gov/news.release/cpi.nr0.htm Accessed on 11 June 2026.
[4] “Gold Price Outlook June 2026: What CPI and the Fed Mean — GoldSilver” https://goldsilver.com/industry-news/article/gold-price-outlook-june-2026/ Accessed on 11 June 2026.
[5] “CME FedWatch Tool — CME Group” https://www.cmegroup.com/markets/interest-rates/cme-fedwatch-tool.html Accessed on 11 June 2026.
[6] “Gold Price Outlook June 2026: What CPI and the Fed Mean — GoldSilver” https://goldsilver.com/industry-news/article/gold-price-outlook-june-2026/ Accessed on 11 June 2026.
[7] “Gold Falls Below $4,100 — TradingKey” https://www.tradingkey.com/analysis/commodities/metal/261960520-xauusd-gold-price-cpi-2026-tradingkey Accessed on 11 June 2026.
[8] “Gold Price Drop to 2-Month Low — EBC Financial Group” https://www.ebc.com/forex/gold-price-drop-xauusd-4100-iran-june-2026 Accessed on 11 June 2026.
[9] “Gold Price — Chart — Historical Data — News — Trading Economics” https://tradingeconomics.com/commodity/gold Accessed on 11 June 2026.
[10] “Gold Price Predictions for 2026 and 2027 — J.P. Morgan Global Research” https://www.jpmorgan.com/insights/global-research/commodities/gold-prices Accessed on 11 June 2026.
[11] “May 2026 CPI Inflation: Consumer Prices Rose Last Month — Fox Business” https://www.foxbusiness.com/economy/cpi-inflation-may-2026 Accessed on 11 June 2026.
