[DAILY TRADING] UKOUSD and USOUSD Analysis 12 June 2026— Crude Oil Prices Fall About 4% After Trump Halts Iran Strike
Vantage Editorial Team >
Vantage Editorial Team >
Vantage is a global, multi-asset broker with a team of in-house writers and market analysts who produce educational and insightful trading content for traders of all levels.
![[DAILY TRADING] UKOUSD and USOUSD Analysis 12 June 2026— Crude Oil Prices Fall About 4% After Trump Halts Iran Strike](https://www.vantagemarkets.co/wp-content/uploads/2026/06/UKOUSD_USOUSD_banner_900x430_optimized-1.webp)
Crude oil prices today dropped sharply after US President Donald Trump cancelled planned airstrikes on Iran late on 11 June 2026 and said a peace deal was in its final stages. [1] Brent crude oil (UKOUSD) was trading near $90.65 per barrel and WTI crude oil (USOUSD) near $87.53 per barrel as of 03:02 UTC (11:02 GMT+8) on 12 June 2026, per the Vantage CFD feed. Both benchmarks have retraced more than 20% from their May 2026 highs. [4]
Key points
- Brent crude (UKOUSD) at $90.65 and WTI (USOUSD) at $87.53 as of 03:02 UTC on 12 June 2026 : both trading below their respective 4H 50-period and 200-period moving averages (MAs).
- Trump cancelled a planned Iran strike on 11 June, the latest in a series of repeated signals that a deal with Iran was approaching since the Middle East conflict began on 28 February 2026; oil fell roughly 4% in extended trading. [1][2]
- The RSI on the TradingView setup used for this analysis reads 36.33 for Brent and 35.73 for WTI, approaching oversold territory. The EIA’s 9 June Short-Term Energy Outlook forecasts Brent averaging $105/bbl in June and July, assuming the Strait of Hormuz remains restricted. [3]
What the charts are showing
UKOUSD (Brent crude oil) 4H
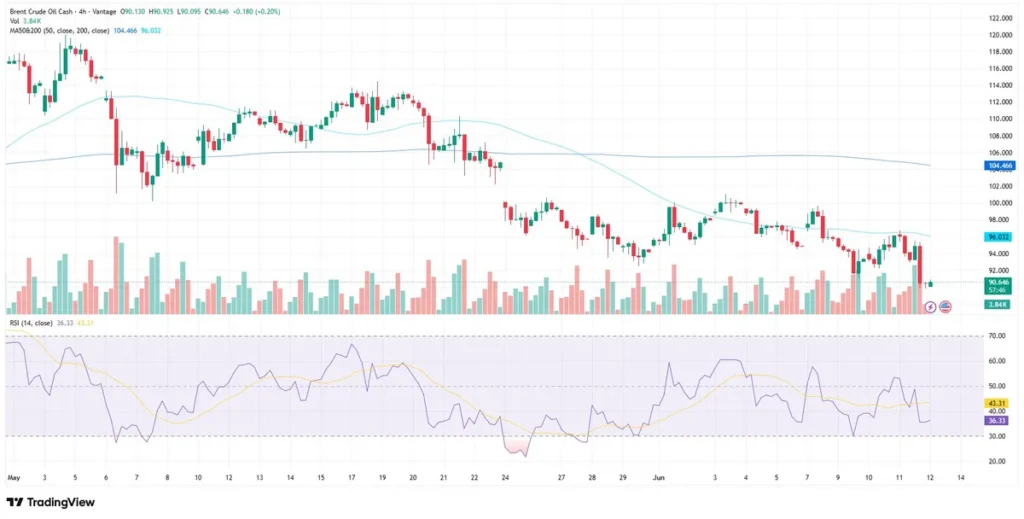
Brent opened the session near $90.13 with an intraday high of $90.925 and low of $90.095 by 03:02 UTC. Price is below the 4H 50-period MA (104.47) and 4H 200-period MA (96.03). The RSI (14, close) on the TradingView setup used for this analysis reads 36.33, with the signal line at 43.31, having crossed below it in early June. Volume on the current bar was 3.84K.
USOUSD (WTI crude oil) 4H
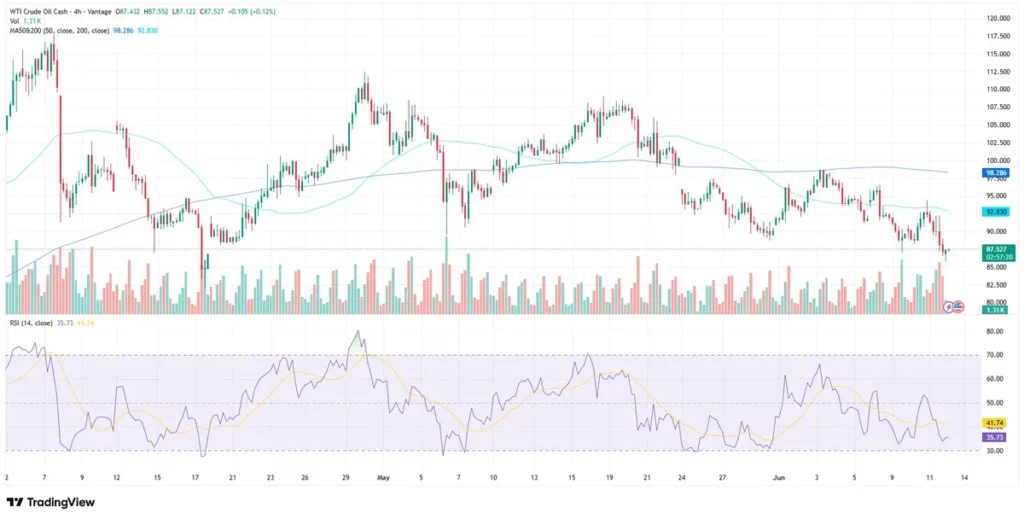
WTI opened near $87.43, with a high of $87.552 and low of $87.122 by 03:02 UTC. It is trading below the 4H 50-period MA (98.29) and 4H 200-period MA (92.83). The RSI (14, close) on the TradingView setup used for this analysis reads 35.73, with signal line at 41.74, approaching, but not yet at, the 30-level oversold threshold. Volume on the 4H bar was 1.31K.
See our guide to learn more about oil trading here.
Why crude oil prices fell today
Trump cancelled strikes planned for the night of 11 June, telling reporters the US had reached what he described as a “great settlement” with Iran, subject to finalisation of documents. [1]Brent futures fell roughly 4.2% in extended trading to around $89.15 per barrel. WTI futures dropped approximately 3.9% to near $86.51 per barrel, CNBC stated. [1]
This marks the latest in a series of repeated signals from Trump that a deal with Iran was approaching since the Middle East conflict began. [2]Markets have responded to each signal, and prices have continued to decline from the May peak of over $116 per barrel for Brent. [4]JPMorgan analysts said their base case remains a Strait of Hormuz reopening by end of June, though they noted rebuilding inventories would likely keep Brent near $100 through year-end. [5]
Key levels for UKOUSD and USOUSD
| Instrument | Support | Resistance | Price (03:02 UTC, 12 Jun 2026) |
| UKOUSD (Brent) | $88.00 / $85.00 | $92.00 / $96.03 (4H 200-period MA) | $90.65 |
| USOUSD (WTI) | $85.00 / $82.50 | $89.50 / $92.83 (4H 200-period MA) | $87.53 |
Table 1: Key reference levels for UKOUSD and USOUSD as of 03:02 UTC, 12 June 2026. Sources: Vantage CFD feed, TradingView. Indicative only.
Brent’s 4H 200-period MA at $96.03 has acted as a ceiling on each recovery attempt since early June. Immediate support sits near $88.00. For WTI, $92.83 (4H 200-period MA) is the key overhead zone; support near $85.00 marks the next reference level below current price.
What to watch
- Baker Hughes oil rig count, 12 June 2026: A continued decline could be interpreted by market participants as a sign of tighter future supply conditions.
- Iran deal document confirmation, Ongoing: Trump said on 11 June the US-Iran agreement is subject to finalisation. Any confirmation or breakdown is the dominant near-term catalyst for both brent crude oil price and WTI crude oil price.
- FOMC minutes, 17 June 2026: Rate expectations shift USD; an inverse correlation with crude prices denominated in dollars makes this relevant for UKOUSD and USOUSD positioning.
Volatility and leverage context
Both UKOUSD and USOUSD have experienced elevated volatility following geopolitical developments. Price swings can be significant during periods of headline-driven trading. Crude oil CFDs can experience substantial volatility during major geopolitical and macroeconomic events. Leverage magnifies both gains and losses. Click here to start trading now!
RISK WARNING: CFDs are complex financial instruments and carry a high risk of losing money rapidly due to leverage. You should ensure you fully understand the risks involved and carefully consider whether you can afford to take the high risk of losing your money before trading.
Disclaimer: The information is provided for educational purposes only and doesn’t take into account your personal objectives, financial circumstances, or needs. It does not constitute investment advice. We encourage you to seek independent advice if necessary. The information has not been prepared in accordance with legal requirements designed to promote the independence of investment research. No representation or warranty is given as to the accuracy or completeness of any information contained within. This material may contain historical or past performance figures and should not be relied on. Furthermore estimates, forward-looking statements, and forecasts cannot be guaranteed. The information on this site and the products and services offered are not intended for distribution to any person in any country or jurisdiction where such distribution or use would be contrary to local law or regulation.
References
[1] “Crude oil prices fall 4% after Trump says U.S. will sign deal with Iran soon – CNBC” https://www.cnbc.com/2026/06/11/brent-wti-oil-prices-us-launches-fresh-strikes-on-iran-.html Accessed on 12 June 2026.
[2] “Trump keeps saying an Iran deal is close. Markets keep believing it – CNBC” https://www.cnbc.com/2026/06/10/trump-iran-deal-oil-markets-stocks.html Accessed on 12 June 2026.
[3] “Short-Term Energy Outlook: Global oil markets – U.S. Energy Information Administration” https://www.eia.gov/outlooks/steo/report/global_oil.php Accessed on 12 June 2026.
[4] “Oil prices fall 20% as traders eye U.S.-Iran ceasefire breakthrough – CNBC” https://www.cnbc.com/2026/05/29/oil-prices-iran-ceasefire-us-trump-strait-hormuz-energy-costs.html Accessed on 12 June 2026.
[5] “Oil falls as Trump tries to convince market an Iran deal is close – CNBC” https://www.cnbc.com/2026/06/09/oil-prices-iran-war-strait-hormuz-trump-israel-lebanon.html Accessed on 12 June 2026.
