XAUUSD Price Today: Gold Falls 25% From January Highs. Is $4,100 the Line That Matters?
Vantage Editorial Team >
Vantage Editorial Team >
Vantage is a global, multi-asset broker with a team of in-house writers and market analysts who produce educational and insightful trading content for traders of all levels.
Gold prices have fallen 25% from the January all-time high of approximately 5,595. The XAUUSD price on the Vantage XAUUSD CFD stood at 4,189.51 as of 01:52 UTC (09:52 GMT+8) on 12 June 2026, down 3.20% on the week and below the 200-day moving average for the first time since October 2023.
Two macro shocks drove the move: a May non-farm payrolls reading of 172,000 against an 85,000 consensus,[1] and a May Consumer Price Index of 4.2% year-on-year.[2] CME FedWatch now prices a 70% probability of at least one Federal Reserve rate hike before December 2026.[3]
All prices are from the Vantage XAUUSD CFD. Charts are from TradingView. This is not financial advice.
Key points
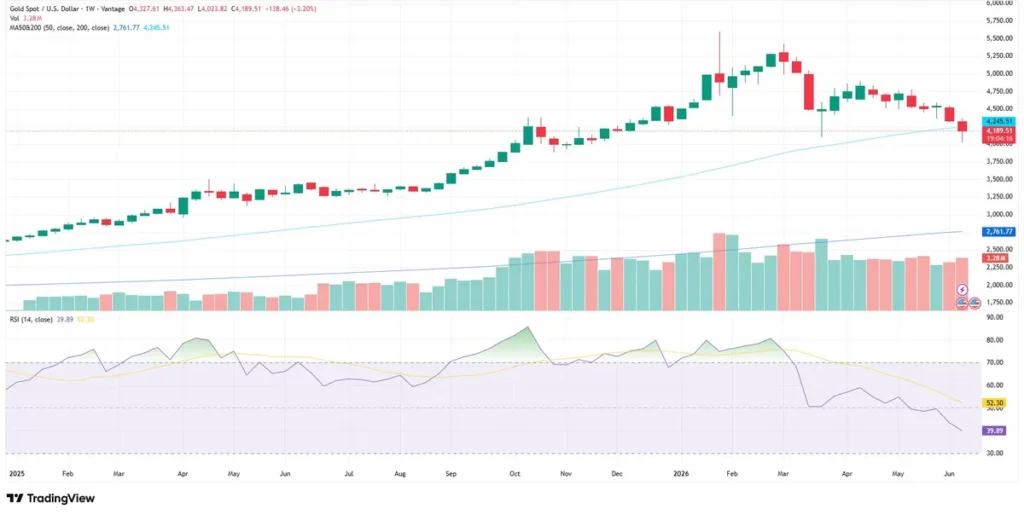
- XAUUSD fell to 4,189.51 on the Vantage XAUUSD CFD as of 12 June 2026, breaking below the 200-week MA at 4,245.51. The weekly RSI stands at 39.89 on the TradingView setup used for this analysis.
- May NFP of 172,000 and May CPI of 4.2% year-on-year combined to push CME FedWatch rate-hike odds for 2026 to 70%, dismantling the rate-cut thesis that had driven gold from $3,248 to the January record of approximately $5,595.
- Structural demand persists: central banks purchased 244 tonnes net in Q1 2026 per the World Gold Council, and China has added to gold reserves for 18 consecutive months. Near-term, elevated real yields have outweighed that support.
What the XAUUSD chart shows this week
The XAUUSD chart shows a bull market that ran from early 2025 to a peak of approximately 5,595 in late January 2026.[4] From that high, the correction followed the escalation of the Middle East conflict in late February, which sent energy prices sharply higher, boosted inflation expectations, and prompted markets to price out Federal Reserve cuts entirely.
On the weekly XAUUSD chart, the 50-week MA sits at 2,761.77 on the TradingView setup used for this analysis. That level marks the long-term structural floor. The 200-week MA at 4,245.51 is the near-term reference; the current weekly candle is trading below it. The weekly RSI (14) has declined to 39.89, approaching oversold territory, with its MA at 52.30.
Switching to the daily XAUUSD chart, the picture sharpens. The 50-day MA has declined to 4,446.65 and the 200-day MA to 4,586.18, both well above the current gold price today. The daily RSI (14) stands at 34.73 on the TradingView setup used for this analysis, with its MA at 37.68. Both readings are in territory last seen in early 2024 for XAUUSD. Volume from the Vantage CFD feed has been elevated on the down sessions, consistent with the intensity of the move.

Three things driving the gold price news this week
The jobs report that rewired rate expectations
May non-farm payrolls came in at 172,000 on 6 June 2026, more than double the 85,000 consensus, according to the Bureau of Labor Statistics.[1] Goldman Sachs removed all 2026 rate cuts from its forecast following the print, pushing expected easing to June and December 2027.[5] CME FedWatch Tool now shows a 70% probability of at least one hike by December 2026 as of 9 June 2026.[3] Gold yields nothing, so a higher opportunity cost from elevated or rising rates weighs directly on the XAUUSD price.
Hot CPI confirmed the pressure
May CPI rose 0.5% month-on-month and 4.2% year-on-year, the highest annual reading since April 2023, driven largely by a 23.5% energy surge linked to the Middle East conflict, according to the Bureau of Labor Statistics.[2] Core CPI came in at 2.9% annually. The US 10-year Treasury yield moved above 4.50%, according to Reuters,[6] creating a yield ceiling on gold prices that does not lift until inflation data moves meaningfully lower.
The Middle East conflict and the energy-inflation loop
Higher energy costs feed directly into headline inflation, which keeps the Federal Reserve restrictive. Gold briefly spiked as a safe-haven asset when the Middle East conflict escalated in late February; the sustained inflation channel that followed has since weighed on gold prices. Bloomberg reported in early June that White House officials indicated Iran nuclear negotiations were making positive progress.[7] Any credible step toward de-escalation that reduces energy price pressure could shift the inflation picture and, with it, the rate-hike calculus currently weighing on XAUUSD.
XAUUSD key levels traders are watching
The table below sets out the support and resistance zones currently in focus for the XAUUSD chart. These are reference levels, not trade signals.
| Pair | Support | Resistance | What is happening |
| XAUUSD | 4,100 / 3,990 | 4,246 / 4,450 | Below 200-day MA; daily RSI at 34.73 approaching oversold |
Table 1: XAUUSD key levels as of 01:52 UTC (09:52 GMT+8), 12 June 2026. Sources: TradingView (Vantage setup), Reuters. Indicative only.
The 4,100 level is the near-term structural reference most frequently cited across current gold news and analysis. EBC Financial Group noted a daily close below it would shift the selloff from a correction into a deeper breakdown signal.[8] The March 2026 low near 3,990 is the broader reference below that.
On the upside, the broken 200-day MA near 4,246 and the 4,450 area are the zones a recovery would need to reclaim on the daily XAUUSD chart to change the current narrative. JPMorgan Research maintained a year-end view of approximately USD 6,000 per ounce,[9] and central banks purchased a net 244 tonnes in Q1 2026 per the World Gold Council.[10] These longer-horizon frameworks form the structural floor limiting how far analysts in those camps expect the current correction to extend.
What to watch this week and beyond
- University of Michigan Consumer Sentiment, 13 June 2026: The June long-term inflation expectations reading is closely watched. A rise reinforces the higher-for-longer rate narrative and adds further pressure on gold prices.
- FOMC meeting, 16 to 17 June 2026: Kevin Warsh is expected to chair his first Federal Reserve meeting. CME FedWatch prices a 97% hold probability at this meeting, but the statement’s language on rate direction is the key read for XAUUSD.
- Middle East conflict developments, Ongoing: Bloomberg has flagged positive progress in Iran nuclear negotiations. Any credible step toward de-escalation reduces energy price pressure and could shift the Fed’s inflation calculus.
- World Gold Council demand data, July 2026: The Q2 2026 Gold Demand Trends report will be the next major read on whether institutional buying has absorbed any of the gold price correction.
Gold news has been moving the XAUUSD price 2% to 3% in single sessions on macro releases and geopolitical headlines. Standard intraday range assumptions are less reliable in this environment. The 4,100 area and the 200-day MA zone remain key technical reference points being monitored by market participants. Volatility remains elevated, particularly around major macroeconomic releases and geopolitical developments.
Leverage is available on gold CFDs at Vantage and magnifies both potential returns and potential losses in equal measure. This is a double-edged instrument. Headline-driven volatility can result in significant price swings. This is not financial advice.
RISK WARNING: CFDs are complex financial instruments and carry a high risk of losing money rapidly due to leverage. You should ensure you fully understand the risks involved and carefully consider whether you can afford to take the high risk of losing your money before trading.
Disclaimer: The information is provided for educational purposes only and doesn’t take into account your personal objectives, financial circumstances, or needs. It does not constitute investment advice. We encourage you to seek independent advice if necessary. The information has not been prepared in accordance with legal requirements designed to promote the independence of investment research. No representation or warranty is given as to the accuracy or completeness of any information contained within. This material may contain historical or past performance figures and should not be relied on. Furthermore estimates, forward-looking statements, and forecasts cannot be guaranteed. The information on this site and the products and services offered are not intended for distribution to any person in any country or jurisdiction where such distribution or use would be contrary to local law or regulation.
References
[1] “Employment Situation Summary, May 2026 – Bureau of Labor Statistics” https://www.bls.gov/news.release/empsit.nr0.htm Accessed on 12 June 2026.
[2] “Consumer Price Index Summary, May 2026 – Bureau of Labor Statistics” https://www.bls.gov/news.release/cpi.nr0.htm Accessed on 12 June 2026.
[3] “CME FedWatch Tool, June 9 2026 – CME Group” https://www.cmegroup.com/markets/interest-rates/cme-fedwatch-tool.html Accessed on 12 June 2026.
[4] “Gold hits all-time high in January 2026 – Reuters” https://www.reuters.com/markets/commodities/ Accessed on 12 June 2026.
[5] “Goldman Sachs removes 2026 rate cuts from forecast, June 2026 – Reuters” https://www.reuters.com/markets/rates-bonds/ Accessed on 12 June 2026.
[6] “US yields and gold price reaction to CPI, June 2026 – Reuters” https://www.reuters.com/markets/ Accessed on 12 June 2026.
[7] “White House: Iran nuclear talks making positive progress – Bloomberg” https://www.bloomberg.com/news/articles/ Accessed on 12 June 2026.
[8] “Gold price drop tests XAU/USD at $4,100 – EBC Financial Group” https://www.ebc.com/forex/gold-price-drop-xauusd-4100-iran-june-2026 Accessed on 12 June 2026.
[9] “Gold Price Predictions for 2026 and 2027 – J.P. Morgan Global Research” https://www.jpmorgan.com/insights/global-research/commodities/gold-prices Accessed on 12 June 2026.
[10] “Gold Demand Trends Q1 2026 – World Gold Council” https://www.gold.org/goldhub/research/gold-demand-trends/gold-demand-trends-q1-2026 Accessed on 12 June 2026.
