The Fed Said Hike. Iran Said Deal. The Dollar Said Nothing.
Vantage Editorial Team >
Vantage Editorial Team >
Vantage is a global, multi-asset broker with a team of in-house writers and market analysts who produce educational and insightful trading content for traders of all levels.

The US Dollar Index (USDX) is trading near 99.181 as of 25 May 2026, 02:00 UTC, holding a choppy 98.85 to 99.58 range for the week as two competing forces pull the dollar in opposite directions.
On one side: FOMC minutes released 20 May confirmed that most Fed officials see rate hikes as necessary if inflation stays persistently above 2%, reinforcing higher-for-longer rate expectations and briefly lifting the USDX to its highest level in six weeks at 99.568 on 20 May.[1][2]
On the other side: Trump announced on 23 May that a deal aimed at reducing tensions around the Strait of Hormuz is ‘largely negotiated,’ with Brent crude falling more than 5% on the news to near $98 a barrel. That energy price relief reduced the inflation pressure underpinning the rate hike case, and the USDX pulled back toward 98.94 by 24 May.[3][4]
The result is a range-bound index waiting for the next catalyst. All prices are as of 25 May 2026, 02:00 UTC, via Vantage CFD. This is not financial advice.
Key Points
- The USDX traded in a 98.85 to 99.58 range this week. It pushed toward 99.568 on 20 May after hawkish FOMC minutes, then retreated to 98.94 as Trump flagged a near-complete Iran deal and Brent crude fell over 5% in a single session.
- FOMC minutes from the 28 to 29 April meeting[1] confirmed most policymakers see rate hikes as the more likely next move if inflation stays above 2%. Markets now price a rate hike by early 2027, a significant shift from the cut-first expectations that opened the year.
- PCE inflation data drops 28 May[5] and May NFP is due 5 June. Both will arrive before Warsh’s first FOMC meeting on 16 to 17 June, making the next three weeks the most data-dense period for USD traders since April.
What the USDX Chart Is Showing This Week
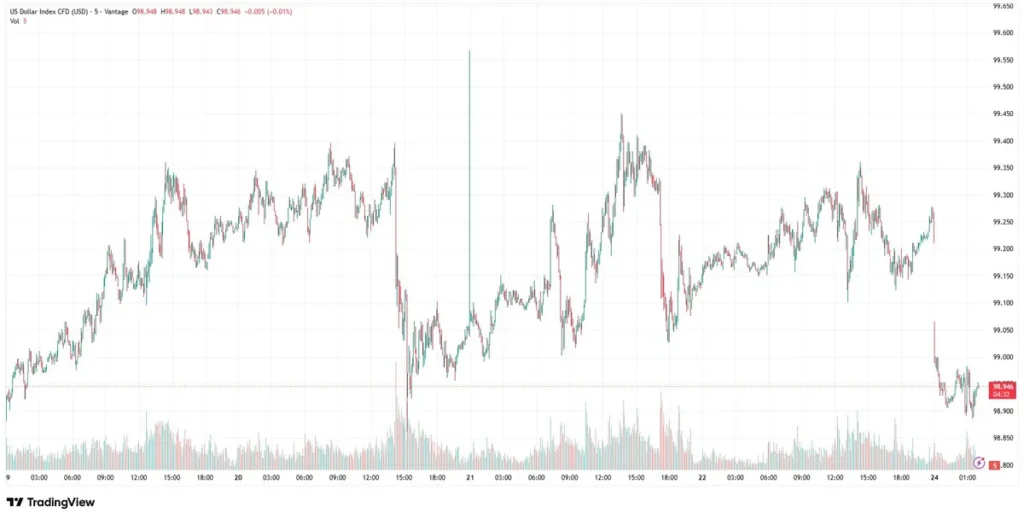
Looking at the 5-minute chart from 19 to 24 May 2026, the USDX opened the week near 98.926, oscillating in a 98.85 to 99.35 band through 19 and 20 May as markets waited for the FOMC minutes.
After the minutes hit around 8:00 pm ET on 20 May, the index moved higher and reached 99.568, its best level in six weeks, during the 22 May session.[1] The chart shows a clear volume spike alongside that move.
From 23 May, the move reversed. Trump’s social media post flagging a ‘largely negotiated’ Iran deal caused Brent crude to drop sharply, which in turn softened the energy-inflation argument supporting rate hike bets. The USDX fell back toward 98.94 on 24 May and is consolidating near 98.946 at time of writing.
The current price action is consistent with a market that lacks a clear trend: neither bulls nor bears have been able to force a sustained break. Volume has moderated following the earlier spike, consistent with a market waiting for fresh data.
Three Things Moving the USDX This Week
1. FOMC minutes: higher-for-longer reinforced
The April 28 to 29 FOMC minutes, released 20 May, showed that a majority of policymakers viewed further rate increases as the likely next step if Middle East tensions kept energy-led inflation above the Fed’s 2% target.[1]
CNBC reported that the meeting featured four dissenting votes, the most since 1992, reflecting genuine disagreement about where rates go next.[6] The 10-year US Treasury yield moved above 4.6% after the minutes, according to Reuters, as markets reassessed the probability of a hike.[2]
This is not a small shift. At the start of 2026, markets were pricing in multiple Fed cuts. Now the base case is a hold through 2026, with a hike possible in early 2027. The minutes did not produce a dollar rally by themselves, but they set the conditions for one.
2. Iran deal: the energy-dollar trap loosens
Trump said on 23 May that a peace agreement with Iran is ‘largely negotiated,’ including a memorandum of understanding as a first phase, before broader talks within 30 to 60 days.[3] Iran’s foreign ministry confirmed the MOU framework.
Brent crude fell as much as 5.2% to near $98 a barrel on the news.[4] That matters for the dollar because the energy-led inflation argument has been the primary driver of rate hike expectations. An agreement intended to stabilise shipping conditions around the Strait of Hormuz and relieve energy price pressure could reduce the urgency of any Fed move, which takes one leg out from under the current USD support.
Trump also said he would not ‘rush’ a deal and it is ‘not even fully negotiated yet,’ so the situation remains fluid. Saudi Aramco’s CEO warned that even if the Strait opened today, the oil market would take until 2027 to normalise fully.[4]
3. The Warsh FOMC transition and the coming data corridor
The Powell-to-Warsh handover is complete. Kevin Warsh’s first FOMC meeting as chair is 16 to 17 June.[7] Before that, three key releases land:
- 28 May: PCE inflation (BEA confirmed), the Fed’s preferred inflation gauge.[5]
- 28 May: Advance Q1 GDP revision (BEA confirmed), giving the fullest picture of US growth since the war began.
- 5 June: May NFP, the first jobs report under Warsh’s watch and the last major labour data before the June meeting.
Kraken Research described this as ‘the data corridor between two structurally significant moments,’ noting that how each print lands relative to the established inflation and labour trends will shape how traders read the new Fed’s opening position.[7]
Key Levels Across USD Pairs
The USDX’s push-pull this week has played out differently across the major pairs. Here is where traders are focused.
| Pair | Level (25 May, 02:00 UTC) | Key Support | Key Resistance | Note |
| USDX | 98.946 | 98.58 (pivot) | 99.31 / 99.58 | Range 98.85 to 99.58 this week |
| EUR/USD | ~1.1641 | 1.1595 / 1.1584 | 1.1645 / 1.1660 | Choppy range 1.1584 to 1.1650; FOMC spike then pullback |
| USD/JPY | ~158.85 | 158.00 | 159.20 / 159.40 | Tight range 158.75 to 159.37; intervention watch above 160 |
| GBP/USD | ~1.34 to 1.35 | 1.3418 to 1.3423 (100-hr/100-day MA) | 1.3465 to 1.3476 | Heavy pressure from rising UK yields |
Table 1: Key levels as of 25 May 2026, 02:00 UTC. Sources: InvestingLive, TradingView, Trading Economics. Indicative only.

EURUSD: The pair traded in a 1.1584 to 1.1650 range this week. The FOMC minutes on 20 May triggered a spike toward 1.16452 before sellers pushed back. As of 25 May 02:05 UTC, EURUSD is at 1.16421, holding just below the 1.1645 to 1.1660 resistance band. The 1.1595 to 1.1600 area is the immediate support below.[8] The FOMC minutes were the primary driver of the break; the Iran deal optimism offered only a brief reprieve.
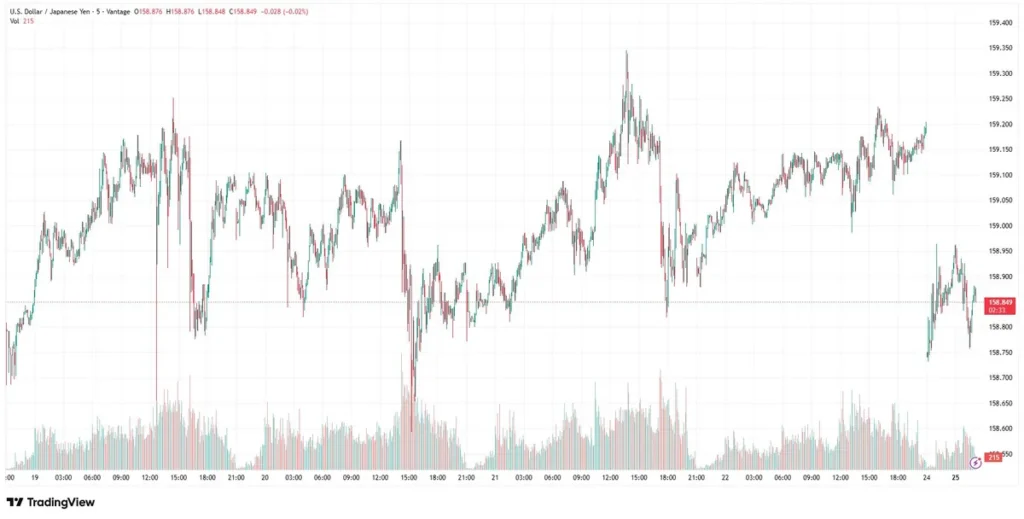
USDJPY: The pair is trading near 158.849 as of 25 May 02:07 UTC, holding a tight 158.75 to 159.35 range for the week. The 21 May session saw a push toward 159.37 following the hawkish FOMC minutes read, before the pair pulled back. The 159.00 to 159.20 area is now the near-term resistance, with 158.75 acting as the week’s floor.[9] Japan’s Ministry of Finance has not intervened but markets continue to watch the 160 level closely.
Risk Management Notes for Active USD Traders
A week where the USDX moves on social media posts and oil price swings in the same session requires specific risk management discipline:
- Headline-driven volatility is not over: The Iran deal is described as ‘not fully negotiated yet.’ Any breakdown in talks could quickly reverse the Brent decline and reignite rate hike expectations, pushing the USDX sharply. The 99.31 and 99.58 resistance levels are the zones to watch for any reversal.
- PCE on 28 May is the next major repricing event: This is the Fed’s preferred inflation gauge and arrives three weeks before Warsh’s first FOMC meeting. A surprise either way is likely to move the USDX out of its current range. Stop Loss levels should account for potential gaps around the 8:30 am ET release time.
- Correlation check: Oil, US Treasuries, and the dollar are moving in tight correlation this week. Traders holding positions across gold (XAUUSD), oil-linked pairs, and short-dollar positions should review combined exposure, as a breakdown in the Iran deal could move all of them simultaneously.
- Leverage in a range-bound market: Leverage amplifies losses from false breakouts as much as it amplifies potential advantages. The USDX has spent most of this week between 98.85 and 99.35, with breakouts above or below proving short-lived. Position sizing relative to account equity is worth reviewing, particularly ahead of the PCE release on 28 May.
RISK WARNING: CFDs are complex financial instruments and carry a high risk of losing money rapidly due to leverage. You should ensure you fully understand the risks involved and carefully consider whether you can afford to take the high risk of losing your money before trading.
Disclaimer: The information is provided for educational purposes only and does not take into account your personal objectives, financial circumstances, or needs. It does not constitute investment advice. We encourage you to seek independent advice if necessary. The information has not been prepared in accordance with legal requirements designed to promote the independence of investment research. No representation or warranty is given as to the accuracy or completeness of any information contained within. This material may contain historical or past performance figures and should not be relied on. Furthermore estimates, forward-looking statements, and forecasts cannot be guaranteed. The information on this site and the products and services offered are not intended for distribution to any person in any country or jurisdiction where such distribution or use would be contrary to local law or regulation.
References
[1] “FOMC Minutes, April 28-29, 2026 — Federal Reserve” https://www.federalreserve.gov/monetarypolicy/fomcminutes20260429.htm Accessed on 25 May 2026.
[2] “US 10-year Treasury yield rises above 4.6% after FOMC minutes — Reuters” https://www.reuters.com/markets/rates-bonds/us-treasury-yields-rise-fomc-minutes-2026-05-20/ Accessed on 25 May 2026.
[3] “Trump says Iran deal reopening Strait of Hormuz largely negotiated — CNBC” https://www.cnbc.com/2026/05/23/us-iran-war-talks.html Accessed on 25 May 2026.
[4] “Oil drops as US says deal with Iran and Hormuz reopening is near — Fortune” https://fortune.com/2026/05/24/oil-prices-us-ceasefire-deal-iran-hormuz-strait-reopening/ Accessed on 25 May 2026.
[5] “PCE Price Index — Next release 28 May 2026 — U.S. Bureau of Economic Analysis” https://www.bea.gov/data/personal-consumption-expenditures-price-index Accessed on 25 May 2026.
[6] “Fed officials see rate hike ahead if inflation stays elevated, minutes show — CNBC” https://www.cnbc.com/2026/05/20/fed-officials-see-rate-hike-ahead-if-inflation-stays-elevated-minutes-show.html Accessed on 25 May 2026.
[7] “FOMC meeting schedule and minutes, June 2026 — Federal Reserve” https://www.federalreserve.gov/monetarypolicy/fomccalendars.htm Accessed on 25 May 2026.
[8] “EURUSD breaks below 50% retracement at 1.16287 — InvestingLive” https://investinglive.com/technical-analysis Accessed on 25 May 2026.
[9] “EURUSD, USDJPY and GBPUSD: bias, risks and key targets — InvestingLive” https://investinglive.com/technical-analysis/what-is-the-bias-risks-and-targets-for-the-eurusd-usdjpy-and-gbpusd-right-now-20260518/ Accessed on 25 May 2026.
[10] “US Dollar Index — Trading Economics” https://tradingeconomics.com/united-states/currency Accessed on 25 May 2026.
