[DAILY TRADING] AUD/USD Analysis 10 June 2026 — Today Hits 0.7019 as NFP Surges 172K and US CPI Looms
Vantage Editorial Team >
Vantage Editorial Team >
Vantage is a global, multi-asset broker with a team of in-house writers and market analysts who produce educational and insightful trading content for traders of all levels.
![[DAILY TRADING] AUD/USD Analysis 10 June 2026 — Today Hits 0.7019 as NFP Surges 172K and US CPI Looms](https://www.vantagemarkets.co/wp-content/uploads/2026/06/AUDUSD_hero-1.webp)
The AUD/USD exchange rate came under pressure this week, with the Vantage AUDUSD CFD trading at 0.70187 as of 07:44 UTC (15:44 GMT+8) on 10 June 2026. The pair shed roughly 1.5% over five sessions following a sharp sell-off on 7 June that coincided with a blowout US jobs report. Both moving averages on the H1 chart now sit above price, and the AUDUSD trend remains downward with RSI sub-40.
All prices are as of 07:44 UTC (15:44 GMT+8), 10 June 2026. Charts are indicative and sourced from TradingView. This is not financial advice.
Key Points
- Vantage AUDUSD CFD was at 0.70187 as of 07:44 UTC on 10 June 2026, with the 50-MA (0.7119) and 200-MA (0.7042) above price acting as resistance.
- US Non-Farm Payrolls (NFP) for May came in at 172,000 against a forecast of 85,000, pushing the US dollar higher and weighing on the AUD/USD exchange rate.[1]
- The RBA holds its next meeting on 16 June 2026 with the cash rate at 4.35%, and market participants are watching closely for any shift in the tightening outlook.[2]
AUDUSD TradingView Chart: What the H1 Setup Is Showing
The AUDUSD chart shows a clear downtrend from the late-May high near 0.7280. The 7 June session was the key structural break: the pair broke below both the H1 50-MA and 200-MA during the 7 June sell-off, and price has remained below both moving averages since.
On the TradingView setup used for this analysis, the 50-MA at 0.7119 and the 200-MA at 0.7042 are now both overhead resistance levels. Price is currently consolidating near 0.7019, a zone that market participants have been monitoring as a potential pause area before the next catalyst.
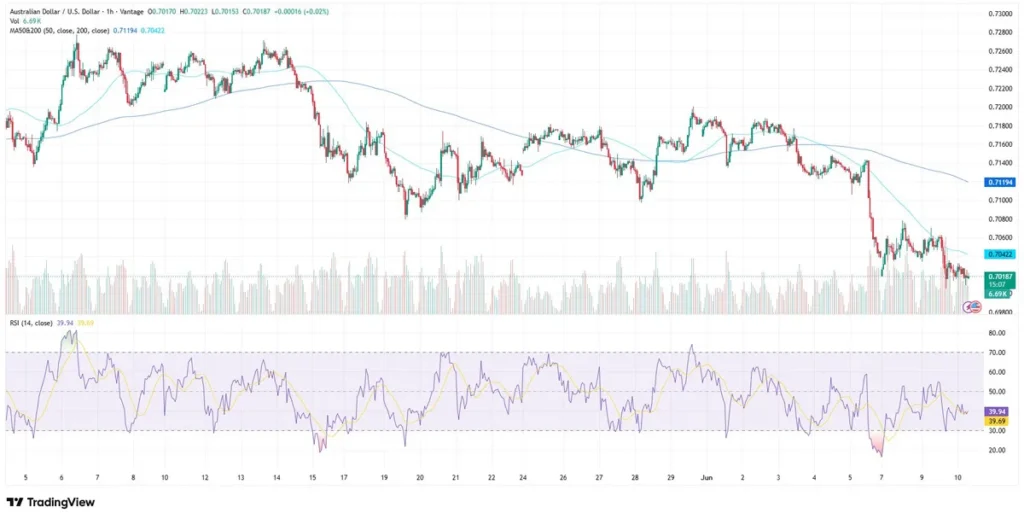
The RSI (14) on the TradingView setup used for this analysis reads 39.94, with the signal line at 39.69. Both are sub-40 but have not reached the 30-level. The RSI dipped sharply below 20 around 7 June before recovering to the current reading. No reversal signal is visible as of the cut-off time.
AUDUSD News: What Is Driving the Pair Lower Today
US jobs beat and dollar strength
The May US Non-Farm Payrolls (NFP) report showed 172,000 jobs added, well above the 85,000 consensus and following an upwardly revised 179,000 in April.[1] The two consecutive above-forecast months reinforced a resilient US labour market picture, reinforcing the market’s higher-for-longer narrative on US rates. The US dollar strengthened across the board, and the AUD/USD exchange rate bore the brunt of that move given the Australian dollar’s sensitivity to risk sentiment.
US CPI for May 2026 was scheduled for release at 08:30 ET (20:30 GMT+8) today, after this article’s cut-off. April headline CPI stood at 3.8% year-on-year.[3] Market consensus ahead of today’s print was pointing to approximately 4.2% for May.[4] A reading in line with or above expectations could reinforce the current AUDUSD downtrend; a softer print may offer short-term relief for the pair.
RBA outlook and Australian data
The RBA raised its cash rate by 25 basis points to 4.35% in May 2026, citing higher energy prices and persistent inflation.[2] The 16 June meeting is the next scheduled decision. Economists are divided on whether the board will pause or continue tightening, with some pointing to the need to see Q2 CPI data before acting further.[5]
Domestic data has been soft. Australian GDP grew just 0.3% quarter-on-quarter in Q1 2026, missing expectations, while the April unemployment rate rose to 4.5% with employment contracting 18,600.[6] A trade surplus of A$1.8 billion in April reversed the prior month’s deficit, but that has not been enough to support Australian dollars to USD against a broadly stronger greenback.[7]
AUDUSD Exchange Rate: Key Levels to Watch
The table below covers the reference zones market participants have been monitoring on the Vantage AUDUSD CFD. These are not trade signals.
| Pair | Support | Resistance | What’s happening |
| AUDUSD | 0.6994 / 0.6950 | 0.7042 / 0.7119 | Below both MAs; RSI sub-40 on the TradingView setup used for this analysis |
| 50-MA (H1) | – | 0.7119 | Declining; price has been below since early June |
| 200-MA (H1) | – | 0.7042 | Price crossed below on 7 June; acting as overhead resistance |
Table 1: Key AUDUSD levels as of 10 June 2026, 07:44 UTC (15:44 GMT+8). Source: TradingView, Vantage AUDUSD CFD. Indicative only.
The 0.6994 area has been identified as potential overlap support on the H4 timeframe, aligning with a 61.8% Fibonacci retracement zone. This level may attract attention if the AUDUSD downtrend extends from current levels. To the upside, the 50-MA at 0.7119 is the first visible resistance on the H1 chart, followed by the 200-MA at 0.7042.
What to Watch: AUDUSD Forecast Drivers This Week
- US CPI (May 2026), 10 June: Released at 08:30 ET (20:30 GMT+8), after this article’s cut-off. April headline was 3.8% YoY. This is the single most significant near-term catalyst for the AUD to USD rate today.
- RBA Decision, 16 June: Current cash rate is 4.35%. Economists are divided on a pause versus further tightening. The outcome will directly influence the AUDUSD trend heading into Q3.
- FOMC Meeting, 16-17 June: First meeting under Fed Chair Kevin Warsh, who was confirmed by the Senate on 13 May 2026. Any shift in the Fed’s communication on rate direction could reprice the US dollar and move the AUDUSD exchange rate sharply.
Risk Considerations for AUDUSD CFD Traders
Market participants tracking the AUDUSD trend often monitor the 0.6994 zone for structural significance. Those managing AUDUSD CFD exposure may consider nearby support and resistance zones when reviewing risk parameters. The 0.6994 support area and the 0.7042 resistance zone are areas market participants often monitor during periods of elevated volatility.
CFD trading on AUDUSD involves leverage, which amplifies both potential gains and potential losses. Position sizing relative to account equity is one factor market participants often consider ahead of major economic releases, including scheduled data events such as the US CPI print.
RISK WARNING: CFDs are complex financial instruments and carry a high risk of losing money rapidly due to leverage. You should ensure you fully understand the risks involved and carefully consider whether you can afford to take the high risk of losing your money before trading.
Disclaimer: The information is provided for educational purposes only and doesn’t take into account your personal objectives, financial circumstances, or needs. It does not constitute investment advice. We encourage you to seek independent advice if necessary. The information has not been prepared in accordance with legal requirements designed to promote the independence of investment research. No representation or warranty is given as to the accuracy or completeness of any information contained within. This material may contain historical or past performance figures and should not be relied on. Furthermore estimates, forward-looking statements, and forecasts cannot be guaranteed. The information on this site and the products and services offered are not intended for distribution to any person in any country or jurisdiction where such distribution or use would be contrary to local law or regulation.
References
[1] “Non Farm Payrolls May 2026 – Trading Economics” https://tradingeconomics.com/united-states/non-farm-payrolls Accessed on 10 June 2026.
[2] “Statement by the Monetary Policy Board: Monetary Policy Decision May 2026 – Reserve Bank of Australia” https://www.rba.gov.au/media-releases/2026/mr-26-12.html Accessed on 10 June 2026.
[3] “Consumer Price Index April 2026 – U.S. Bureau of Labor Statistics” https://www.bls.gov/news.release/cpi.htm Accessed on 10 June 2026.
[4] “What to Expect From the May CPI Report – Kiplinger” https://www.kiplinger.com/investing/economy/cpi-report-may-2026-what-to-expect Accessed on 10 June 2026.
[5] “RBA Has Room to Pause After May Rate Hike – Commonwealth Bank of Australia” https://www.commbank.com.au/articles/newsroom/2026/05/rba-may-interest-rates-cba-economists-analysis.html Accessed on 10 June 2026.
[6] “Labour Force, Australia, April 2026 – Australian Bureau of Statistics” https://www.abs.gov.au/statistics/labour/employment-and-unemployment/labour-force-australia/latest-release Accessed on 10 June 2026.
[7] “International Trade in Goods, April 2026 – Australian Bureau of Statistics” https://www.abs.gov.au/statistics/economy/international-trade/international-trade-goods/latest-release Accessed on 10 June 2026.
