[DAILY TRADING] SP500 Analysis 11 June 2026 — Where the Index Stands After CPI and Iran Escalation
Vantage Editorial Team >
Vantage Editorial Team >
Vantage is a global, multi-asset broker with a team of in-house writers and market analysts who produce educational and insightful trading content for traders of all levels.
![[DAILY TRADING] SP500 Analysis 11 June 2026 — Where the Index Stands After CPI and Iran Escalation](https://www.vantagemarkets.co/wp-content/uploads/2026/06/SP500_banner_900x430_balanced_optimized-1.webp)
The S&P 500 CFD closed Wednesday’s session at 7,266.99, a multi-week low, after May CPI printed 4.2% year-on-year, the highest annual reading since April 2023, and reports confirmed fresh US strikes on Iranian positions. On 11 June, the 4H candle opened at 7,267, printed a low of 7,236, and has recovered to 7,302 as of 01:34 UTC.[1][2]
On the 4H chart, price has broken below both key moving averages and the RSI(14) is approaching oversold levels. Prices are sourced from the Vantage SP500 Cash CFD. Data as of 01:34 UTC on 11 June 2026 (09:34 GMT+8). This is not financial advice.
Key Points
- The SP500 Cash CFD is trading at 7,302.40 as of 01:34 UTC on 11 June 2026, recovering from Wednesday’s close of 7,266.99, which fell 1.62% after May CPI rose 4.2% year-on-year, the highest annual reading since April 2023, driven largely by a 3.9% monthly jump in energy prices tied to the Middle East conflict.
- On the 4H chart, price is trading below both the 4H 50-period MA at 7,504 and the 4H 200-period MA at 7,405. The 11 June candle opened at 7,267, printed a low of 7,236, and has recovered to 7,302 as of 01:34 UTC. RSI(14) reads 35.97 per the TradingView setup used for this analysis, still below the signal line at 37.57.
- CME FedWatch prices a 96.3% chance the Fed holds at 3.50%-3.75% at the 16-17 June FOMC meeting, Kevin Warsh’s first as chair, with fed funds futures reflecting reduced rate-cut expectations and a more hawkish lean for the second half of 2026.
What the SP500 chart is showing
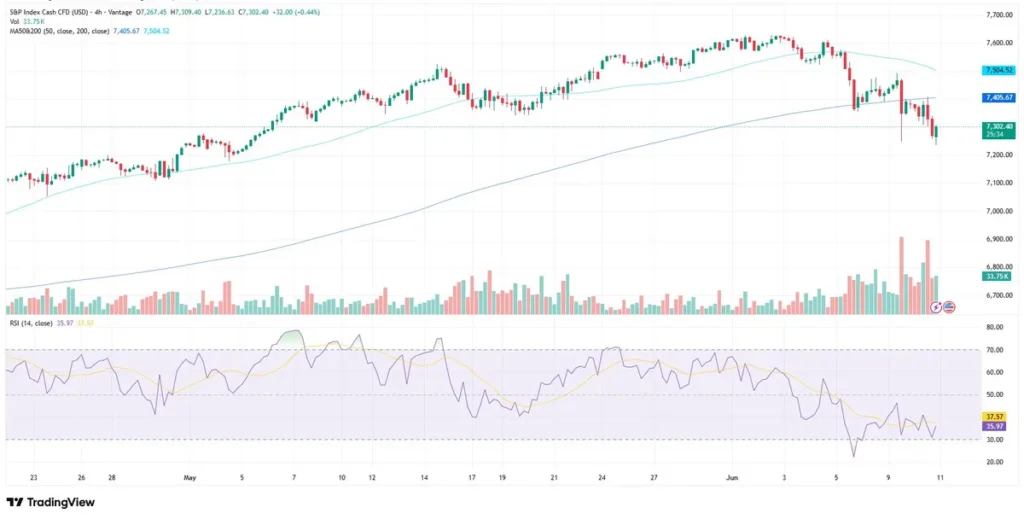
The 4H chart covers late April through 11 June 2026. From a low near 7,100 in late April, price climbed steadily, reaching a record high of 7,609.78 on 2 June 2026 before a sustained reversal set in. The decline accelerated through the first week of June, with the largest red volume bars on the Vantage CFD feed visible in the 9-10 June sessions.
Price broke below the 4H 50-period MA at 7,504 during that move and has not reclaimed it. The 4H 200-period MA at 7,405 sits approximately 103 points above the current price of 7,302 and has been above price since the breakdown. The 4H 50-period MA at 7,504 is further overhead; it has turned lower while the 4H 200-period MA remains on a shallower, flatter slope.
The RSI(14) per the TradingView setup used for this analysis reads 35.97 on the 11 June candle, with the signal line at 37.57. The RSI dropped to near 25 around 5 June before partially recovering. On 11 June it is edging back toward the signal line but remains below it, indicating momentum has not yet turned positive.
SP500 today: CPI, Iran, and the FOMC
The Bureau of Labor Statistics reported that May CPI rose 0.5% month-on-month, lifting the annual rate to 4.2%, the third consecutive monthly acceleration in headline inflation.[3] The headline matched consensus, keeping surprise risk limited.
More notably, core CPI rose just 0.2% month-on-month against a 0.3% estimate, and 2.9% year-on-year.[3] Much of the headline surge came from energy: gasoline was up 7.0% for the month, with the Stephens CPI update noting a 3.9% monthly rise in the energy component overall.[4]
On the geopolitical side, US forces conducted fresh strikes on Iranian positions following reports that a US Army Apache helicopter went down near the Strait of Hormuz. President Trump attributed the incident to Iranian action; Iran did not confirm responsibility, and CENTCOM stated the cause was under investigation.[2]
The Middle East conflict’s effect on the S&P 500 index runs directly through energy prices and their pass-through to inflation expectations. Industrials fell over 3% in Wednesday’s session; tech and materials each dropped over 2%.[1]
The 16-17 June FOMC meeting is Kevin Warsh’s first as chair. CME FedWatch showed a 96.3% probability of a hold at 3.50%-3.75% following the CPI release.[5] The broader rate narrative has shifted: futures markets have reduced expectations for rate cuts and shifted toward a more hawkish outlook for the second half of 2026.
The April FOMC minutes noted equity markets had stayed resilient on strong earnings even amid geopolitical uncertainty, a dynamic that has since reversed materially.[6]
SP500 price: key levels to watch
| Level type | Price (USD) | Zone | Notes |
| Resistance 1 | 7,504 | 4H 50-period MA | Price broke below and has not recovered this level |
| Resistance 2 | 7,405 | 4H 200-period MA | 50-MA turning lower while the 200-MA remains longer-term support |
| Resistance 3 | 7,610 | 2 June record high | Record high close on 2 June 2026 before the multi-session selloff |
| Support 1 | 7,200 | Round-number zone | Held on prior pullbacks during mid-May consolidation |
| Support 2 | 7,100 | Structural low | Late-April base from which the May rally originated |
Table 1: SP500 Cash CFD key levels as of 11 June 2026, 01:34 UTC. Sources: Vantage SP500 Cash CFD, TradingView. Indicative only.
What to watch
- May PPI, 11 June: Producer prices land at 08:30 ET (20:30 GMT+8), the second consecutive inflation read in the FOMC’s deliberation window ahead of 16-17 June.
- FOMC, 16-17 June: Warsh chairs his first meeting. The updated dot plot and press conference language on inflation and the Middle East conflict are the key watch points.
- 4H 50-period MA at 7,504: First resistance zone. Watch whether intraday recoveries test and fail here, or whether sustained price action above it materialises.
- Middle East conflict: Any shift in the US-Iran situation moves oil prices directly, which feeds headline CPI expectations and equity sentiment.
On market volatility: the SP500 CFD has been reacting to geopolitical headlines within minutes. Intraday ranges have widened compared to prior-month averages. Market participants often monitor the 7,200-support area and the 7,504-resistance zone during periods of elevated volatility, particularly ahead of scheduled data releases and central bank meetings.
Leverage in index CFD trading amplifies moves in both directions. With position sizing relative to account equity, the current environment, with back-to-back inflation data and a headline-sensitive geopolitical backdrop, may result in wider intraday price fluctuations than are typically observed during lower-volatility periods.
RISK WARNING: CFDs are complex financial instruments and carry a high risk of losing money rapidly due to leverage. You should ensure you fully understand the risks involved and carefully consider whether you can afford to take the high risk of losing your money before trading.
Disclaimer: The information is provided for educational purposes only and doesn’t take into account your personal objectives, financial circumstances, or needs. It does not constitute investment advice. We encourage you to seek independent advice if necessary. The information has not been prepared in accordance with legal requirements designed to promote the independence of investment research. No representation or warranty is given as to the accuracy or completeness of any information contained within. This material may contain historical or past performance figures and should not be relied on. Furthermore estimates, forward-looking statements, and forecasts cannot be guaranteed. The information on this site and the products and services offered are not intended for distribution to any person in any country or jurisdiction where such distribution or use would be contrary to local law or regulation.
References
[1] “Dow dips 900 points as US signals more strikes in Iran, TheStreet” https://www.thestreet.com/stock-market-today/stock-market-today-dow-jones-sp-500-nasdaq-updates-june-10-2026 Accessed on 11 June 2026.
[2] “US, Iran Exchange Strikes After American Apache Downed Near Hormuz Strait, Bloomberg” https://www.bloomberg.com/news/articles/2026-06-10/us-iran-attack-each-other-over-apache-downed-near-hormuz-strait Accessed on 11 June 2026.
[3] “CPI inflation report May 2026: Prices rose 4.2% annually, CNBC” https://www.cnbc.com/2026/06/10/cpi-inflation-report-may-2026.html Accessed on 11 June 2026.
[4] “Consumer Price Index Update June 2026, Stephens” https://www.stephens.com/perspectives/consumer-price-index-update-june-10-2026 Accessed on 11 June 2026.
[5] “CME FedWatch Tool, CME Group” https://www.cmegroup.com/markets/interest-rates/cme-fedwatch-tool.html Accessed on 11 June 2026.
[6] “FOMC Minutes, April 28-29, 2026, Federal Reserve” https://www.federalreserve.gov/monetarypolicy/fomcminutes20260429.htm Accessed on 11 June 2026.
